
Jump
Published on July 9, 2025 | Last Updated on September 13, 2025
In an era of unprecedented change, organisations across all sectors face an increasingly complex landscape of disruptions that can fundamentally alter their performance trajectories. From technological innovations and regulatory shifts to supply chain interruptions and market volatility, these disruptions present both significant challenges and remarkable opportunities. The “Effects of Disruption on Performance” model introduced in this article offers a structure that explores how organisations can identify, prepare and respond to these disruptions. The model distinguishes between disruption polarity – whether they represent an opportunity or challenge – and critically examines the quality of organisational responses that ultimately determine the performance outcomes. The model recognises that many disruptions, when managed adaptively, can serve as catalysts for performance elevation and competitive advantage.
Drawing from construction industry examples, the article explores how organisations can develop appropriate response strategies and build the necessary capabilities to face known, expected and unexpected disruptions.
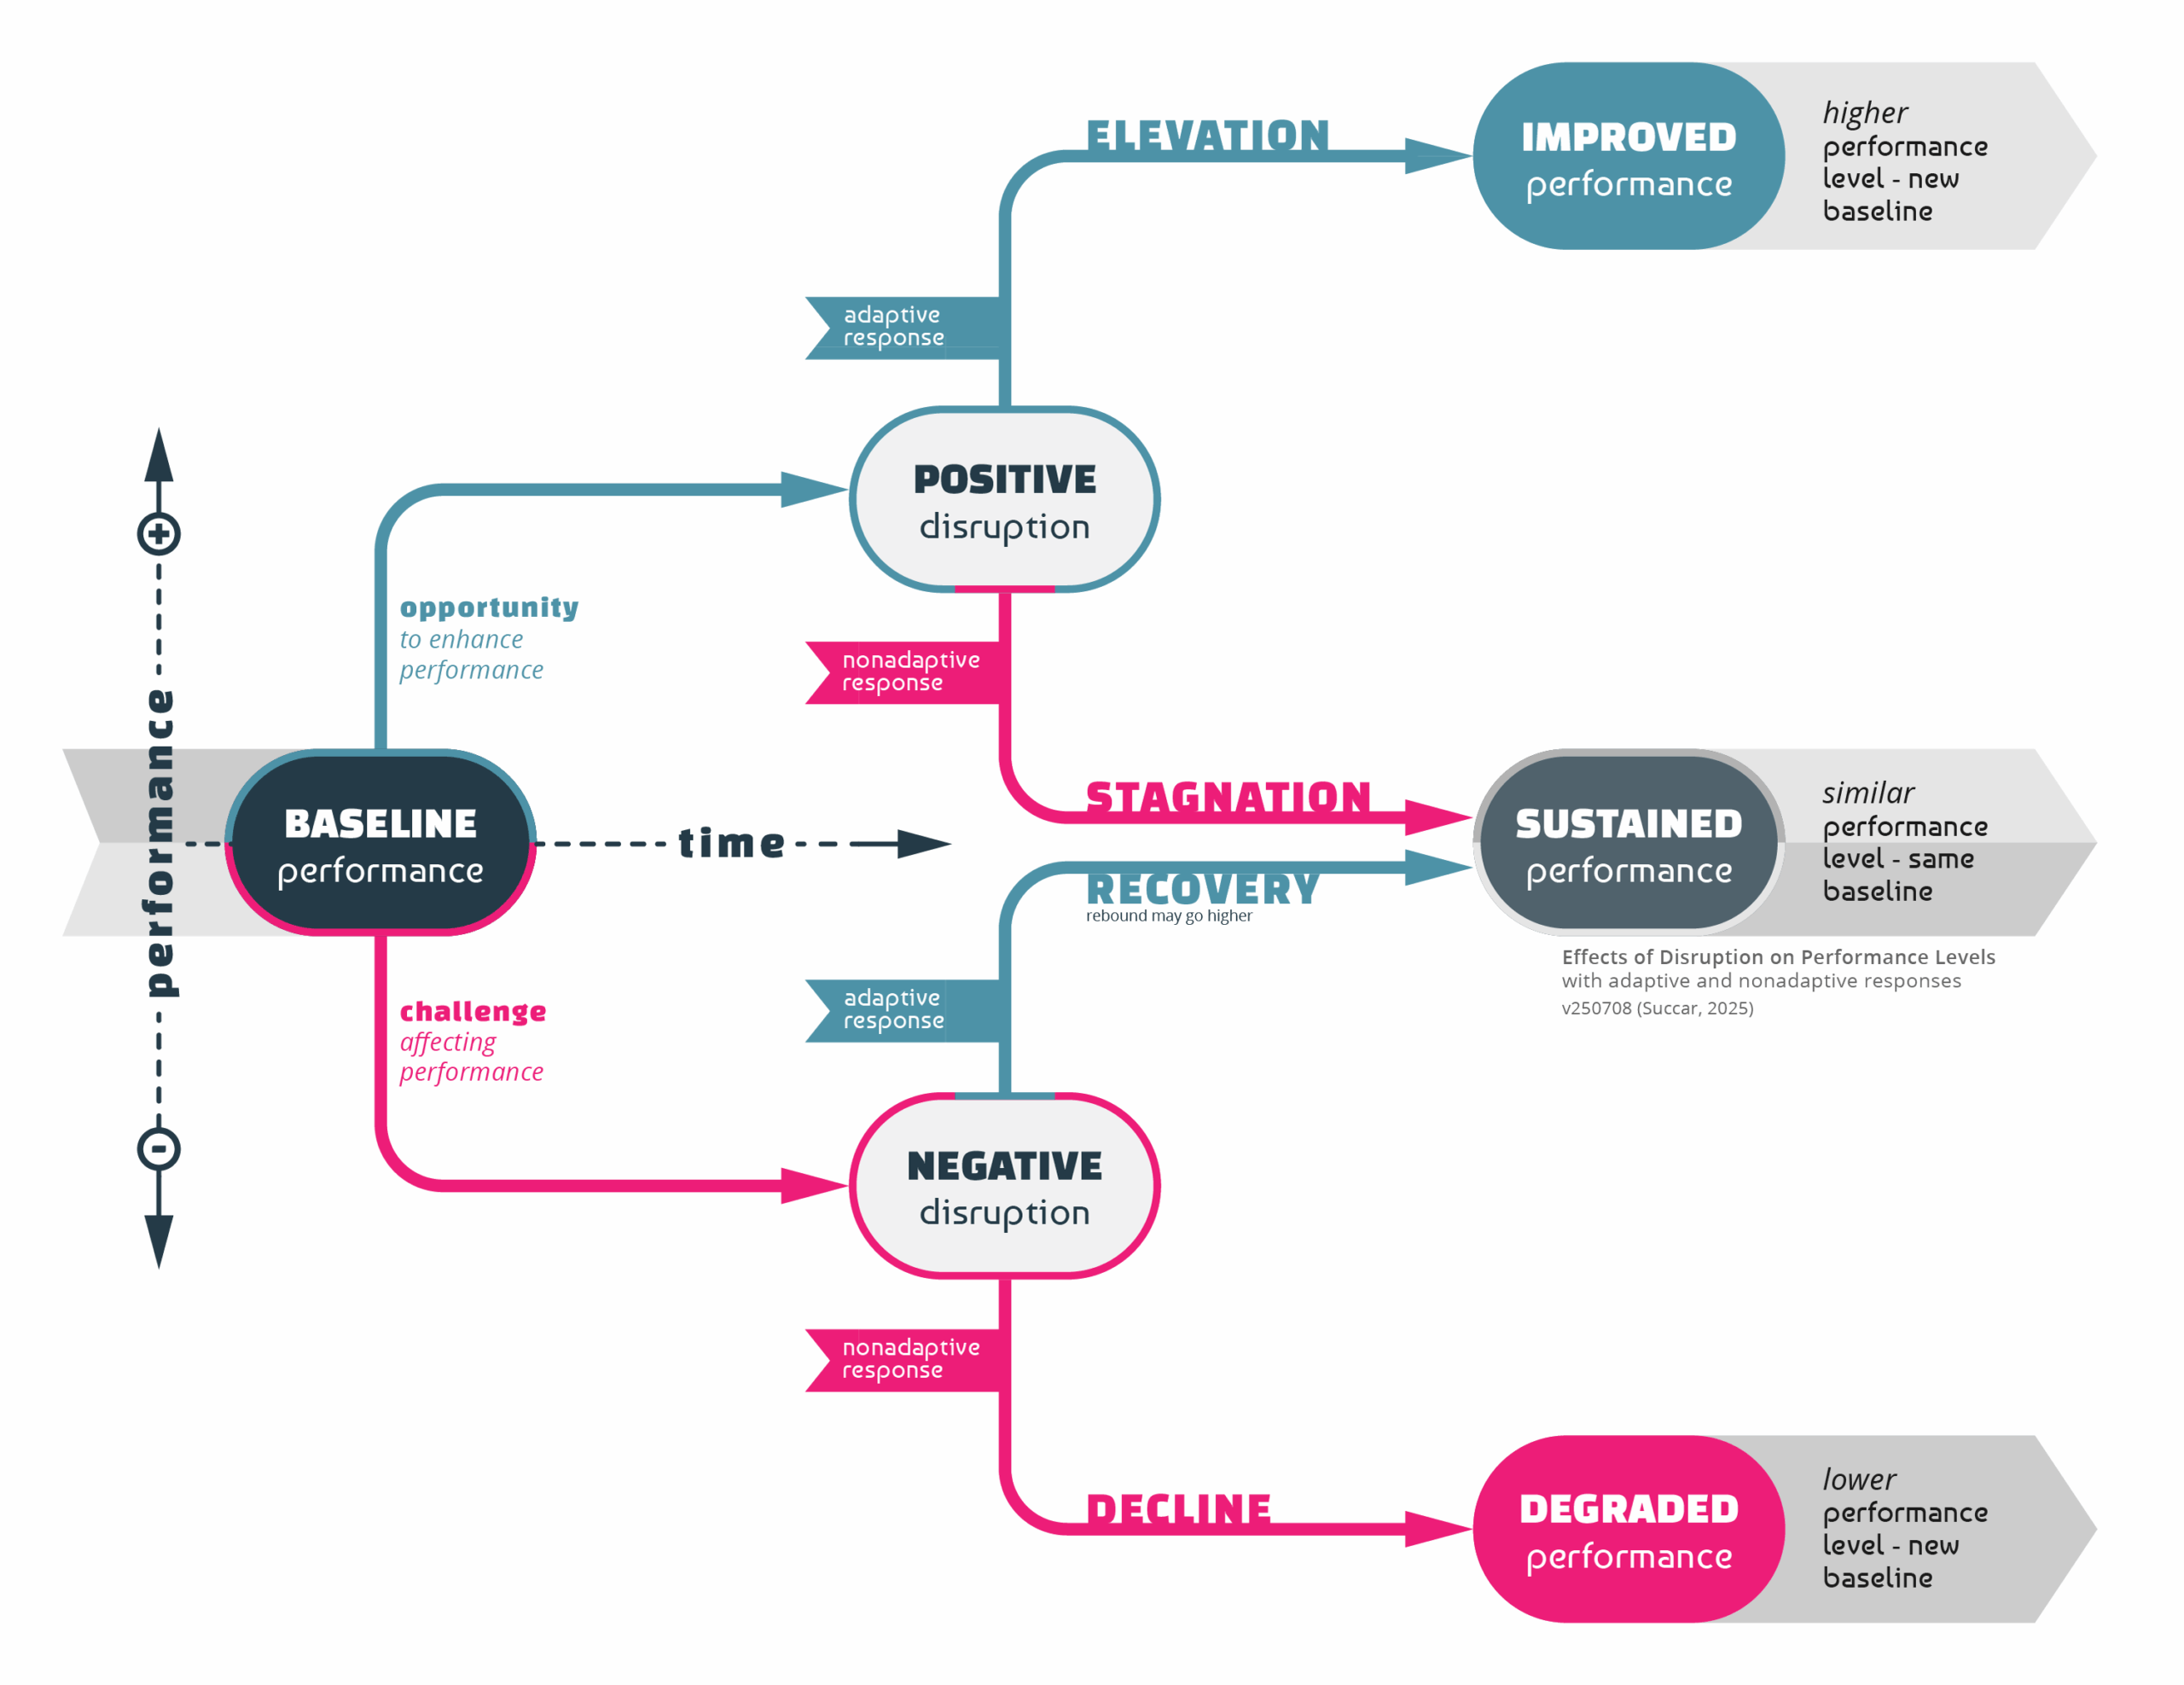
Figure 1. Effects of Disruption on Performance (v250708 model)
The “Effects of Disruption on Performance” model (Figure 1) above illustrates how specific disruptions can affect an organisation’s performance. The model distinguishes between disruption polarity (vertical axis: positive disruptions are indicated in blue and upward, while negative disruptions are shown in red and downward), the quality of responses to these disruptions (represented by small flags on the arrows), and the impact of such disruptions on performance over time (horizontal axes with three gradations). As discussed further below, the model primarily addresses distinct, short- and medium-term disruptors, excluding persistent long-term factors such as climate change. Beginning from a nominal baseline (central horizontal axis), shifts in performance – either improvements or deteriorations – are depicted as adjusted baselines, reflecting the comparison of organisational outcomes before and after each disruption.
What are performance disruptions?
A “performance disruption” refers to any event, innovation, or shock that fundamentally changes performance conditions. By assessing the impact of discrete (identifiable and isolatable) disruptions, they can be classified according to the polarity of their net effect, known as Disruption Polarity: a Positive Disruption (+D) introduces new capabilities or efficiencies that, when adopted and implemented at scale, raise performance above the established baseline; and a Negative Disruption (-D) introduces risks or obstacles which, if not properly managed, cause performance to fall below the baseline.
To be accounted for, performance disruptions need to be measurable (quantitative or qualitative data) and exceed a specific threshold (e.g. 10% deviation from the baseline). Disruptions are most easily identifiable when tied to Key Performance Indicators (KPIs) such as productivity, efficiency, and safety. It is important to note that the same disruption may constitute a +D for one organisation (an opportunity to improve) or a -D for another (a challenge to be overcome). For example, the imposition of high tariffs by the government on imported components may present a challenge to importers and an opportunity to local manufacturers.
Distinguishing between the origins and types of disruptions is essential. From a Disruption Origin perspective, an External Disruptor refers to a significant event originating outside the organisation, similar to supplier delays, regulatory adjustments, or market volatility. In contrast, an Internal Disruptor denotes a catalyst arising from within the organisation itself, similar to process redesign, leadership changes, system migrations, or the unexpected loss of human or financial resources.
Also, there are a variety of Disruption Sources that require relevant responses. For example, a disruption may be caused by technological innovations affecting established workflows (e.g. the emergence of Large Language Models); regulatory shifts causing changes in tariffs, building codes, environmental regulations, or labour laws; and supply chain disruptions driven by geopolitical tensions, transportation bottlenecks, or severe weather events. These distinctions are useful for isolating causes and effects but, in most cases, disruption is a complex phenomenon that comprises multiple overlapping sources [Note: as a reminder of this complexity, please review this expansive description of BIM].
Response to disruptions
Responses to disruption refer to the actions taken by organisations upon experiencing a disruptor. These responses can be broadly distinguished by their Response Quality – being either Adaptive or Nonadaptive. An Adaptive Response (AR) is represented by the proactive identification and management of disruption, followed by the implementation of measures leading to performance improvement or recovery. In contrast, a Nonadaptive Response (NAR) is characterised by the absence or insufficiency of effective actions to address disruption, which often results in stagnation or decline in performance.
By mapping Response Quality to Disruption Polarity, we can identify four Disruption Response Types (DRT)s with a Disruption Response Matrix (DRM) (Table 1):
| Adaptive Response (AR) | Nonadaptive Response (NAR) | |
|---|---|---|
| Positive Disruption (+D) | Performance Elevation – Benefits from opportunity – Achieves higher performance baseline |
Performance Stagnation – Localised, partial or temporary gains – Failed scaling (stalled uptake) |
| Negative Disruption (-D) | Performance Recovery (or rebound) – Resilience (baseline restoration) – Antifragility (> baseline) |
Performance Decline – Sustained deterioration – Compounded degradation |
Table 1. Disruption Response Matrix with four Disruption Response Types
The four Disruption Response Types are explained below with examples of both external and internal disruptors:
- Performance Elevation (Positive Disruption + Adaptive Response): Organisation A responds to a positive disruption effectively, yielding a new sustained performance level above the pre-disruption baseline. Examples:
- External Disruptor: a leading supplier introduces Organisation A to an innovative off-site modular panel system (+D) that requires significant changes to typical design and logistics workflows across projects. Organisation A invested the necessary effort to execute the necessary changes, and the new panel system allowed it to achieve a reduction of on-site assembly time by 16%.
- Internal Disruptor: Organisation A disrupts its own operations by developing an advanced in-house open BIM solution (+D). After an initial loss of productivity to complete staff training and integrate the innovation into core operations, the organisation managed to achieve a 21% drop in rework across projects.
- Note: repeated adaptive responses to multiple positive disruptions lead to continual performance improvement (stepped gains).
- Performance Stagnation (Positive Disruption + Nonadaptive Response): Organisation B fails to scale a positive disruption beyond the initial stage (e.g. a pilot project yielding positive outcomes), resulting in no net change in performance levels. Examples:
- External Disruptor: a low-carbon concrete product is introduced into the market at competitive prices (+D). Organisation B, a large contractor, pilots these compliant mixes on one project with excellent results. Due to poor communication and documentation, this success wasn’t replicated across the enterprise, and the overall carbon metrics were unchanged.
- Internal Disruptor: the head office of Organisation B decided to deploy a more efficient cloud-based document management solution (+D) across the enterprise, but most local branches deferred migration for a variety of reasons. The patchy deployment of the solution resulted in minuscule improvements in document retrieval times with no effect on overall information management efficiency.
- Performance Recovery or Rebound (Negative Disruption + Adaptive Response): Organisation C successfully responds to a negative disruptor that initially affected performance, and then either (a) restores its performance to pre-disruption baseline within a defined recovery window – thus indicating resilience; or (b) rebounds its performance to a higher level than the pre-disruption baseline – thus indicating antifragility (Taleb, 2014). Examples:
- External Disruptor: A supplier delay in precast concrete (-D) threatens construction schedules. Organisation C, the contractor, enacts pre-approved alternate sourcing and rescheduling protocols, restoring timelines within three weeks.
- Internal Disruptor: An ERP system outage (-D) halts procurement. The IT and procurement teams execute an offline order process, recovering baseline cycle times within five days, thus providing enough time to restore the online system.
- Performance Decline (Negative Disruption + Nonadaptive Response): Organisation D fails to detect or address a negative disruption, leading to a degraded performance below the baseline. If the disruptor has long-term effects, and with the absence of mitigation efforts, the impact of negative disruptions may be compounded, resulting in a sustained degradation in performance to lower and lower levels. Examples:
- External Disruptor: a surprise change in tariffs (-D) halts the imports of the equipment necessary to complete the tunnelling project. Without a mitigation plan or quick managerial decisions to find replacements, the project stalls, and milestones slip indefinitely.
- Internal Disruptor: a poorly managed office relocation (-D) misplaces critical 3D scanning equipment and other tools needed by the team. With no interim solutions found, deliverables fall behind, causing cascading project delays.
- Note: repeated Nonadaptive responses to consecutive negative disruptions lead to compacted performance decline (stepped degradation leading to terminal decline).
Preparing for disruptions
Organisations can either respond to disruptions or prepare for them. This, of course, depends on whether these disruptions are identifiable (known), probable (expected) or unexpected/improbable (Table 2):
| External Disruptors | Internal Disruptors | |
|---|---|---|
| Identifiable Disruptions | Planned changes to codes, tariffs, energy costs | Planned CEO Retirement, office relocation, technology deployment |
| Probable Disruptions | [what was previously considered improbable until it occurred] | [what was previously considered improbable until it occurred] |
| Unexpected, Improbable Disruptions | Global pandemic, disruptive technology affecting whole markets (e.g. LLMs), alien invasion | Sudden loss of key staff, catastrophic event destroying key resources, CFO convicted of insider trading |
Table 2. Disruption Likelihood Matrix
While it is difficult for organisations to prepare for unexpected/improbable disruptions (except maybe through antifragility exercises), capable organisations must prepare for identifiable disruptions and mature organisations can prepare for probable ones. This is clarified in the preparedness levels table (Table 3).
| Preparedness Level | Identifiable Disruptions | Probable Disruptions |
|---|---|---|
| Ready | Prepare pre-approved and tested response protocols | Prepare resource buffers (finance and human talent) |
| Capable | Automate monitoring triggers (to minimise response time) | Conduct regular stress-testing exercises simulating negative disruptors |
| Mature | Develop dedicated disruption response teams (trained on a variety of scenarios) | Embed redundancy protocols in all workflows |
Table 3. Disruption Preparedness Levels (examples)
From concepts to actions – a BIM example
After clarifying key concepts, the following section introduces an Action Plan to improve the disruption readiness of organisations. In the plan below, we will use the Point of Adoption model to provide construction-specific examples:
- CLASSIFY disruptions using Polarity (+D/-D), Origin (External/Internal), and Likelihood (Table 2) to triage responses. Here, it is important to be granular in defining disruptions. For example, to adopt BIM, consider using the BIM Capability Stages model with each Stage – modelling, collaboration, and integration – as a separate disruptor. Also, use the BIM Maturity Levels to define performance improvement targets for relevant technologies, processes, and policies.
- DEPLOY the Disruption Response Matrix (Table 1):
- For +D events: Enforce resource commitment thresholds (e.g. 15% of the relevant budget) to enable performance elevation and avoid stagnation. For example, if the exclusive submission of open BIModels is mandated by public procurers by due date X, the organisation must dedicate the resources necessary to ensure proper implementation and diffusion of relevant tools, procedures, and protocols on these project types before the due date.
- For -D events: Activate recovery triggers with – where possible – rebound/antifragility targets to exceed the baseline within X days post-disruption. For example, if the organisation’s servers fail twice within a specified period Y causing disruptions to design collaboration workflows within the Common Data Environment, activate the backup cloud servers and initiate server upgrade activity using contingency funds earlier than originally planned.
- BUILD CAPACITY by mapping disruptors to the organisation’s Disruption Preparedness Level (Table 3):
- Identifiable disruptors: Define Adaptive Responses (AR)s of each identifiable scenario.
- Probable disruptors: Conduct stress-tests simulating probable scenarios.
- All disruption events: Track AR/NAR ratio as a leadership KPI.
Other quick examples – LLMs and blockchain in construction
Another two examples, Large Language Models (LLMs) and Blockchain solution in the construction/real-estate sectors, are powerful Positive Disruptors – if managed adaptively – or damaging Negative Disruptors if ignored or badly managed.
LLMs in construction
Even the most basic use of LLMs by a construction company may present either an Elevation potential or a Stagnation trap:
- Elevation potential: LLMs enable automated RFI drafting, contract review, and onsite progress summaries can save valuable admin time and – once standardised – drive consistency across projects. Based on the Organisation’s Preparedness Level (Table 3), it may be:
- An Adaptive response:
- Define clear use-cases (e.g. RFI generation, design-review auto checks)
- Pilot in a controlled environment (single project or team)
- Update data-governance policies (prompt quality, model retraining, security)
- A Nonadaptive risk: Unvetted prompts may produce specification errors, expose IP or lock teams into unreliable “black box” outputs
- An Adaptive response:
- Stagnation trap: Isolated chatbot deployment without ample training and workflow integration may cause error amplification (+D may become -D due to reputational damage) leading to abandoning or delaying the full deployment.
Blockchain in construction
For a public authority – such as a large municipality – blockchain solutions enables immutable registers of infrastructure assets (e.g. building, bridges, or streetlights) and smart contracts for service level agreements (e.g. automated payments when maintenance milestones are met). These solutions present opportunities/challenges as explained below:
- Elevation potential: The tokenisation of assets (e.g. parcels of land, leased equipment) creates tradable digital representations that improve transparency and liquidity thus reducing administrative disputes and accelerating funding cycles.
- An Adaptive response:
- The municipality conducts a pilot a citywide asset registry on blockchain, combining smart contracts for maintenance workflows with tokenised representations of high value assets
- Co-designs data schemas and service standards with asset owners, operators and finance teams
- Integrates smart contracts into municipal budgeting and procurement systems; deploy tokenised asset tracking via public portals
- A Nonadaptive risk: Fragmented pilots focusing only on tokenisation or smart contracts in isolation of other municipal processes may generate parallel systems that overburden IT staff and fail to deliver real transparency or any net performance gains.
- An Adaptive response:
- Stagnation trap: A blockchain supply chain ledger succeeds on one pilot asset type but – with the absence of a follow-up rollout mandate – concludes with stalled uptake with enterprise KPIs remaining flat.
In summary
By systematically classifying, responding to, and building capacity for performance disruption, organisations can transform uncertainty into a catalyst for growth. I hope that this article clarified that using structured models and proactive strategies not only strengthens resilience but also positions organisations and teams to capture opportunities arising from inevitable internal and external challenges. Ultimately, by embedding disruption readiness into daily operations, a ready, capable and mature organisation can remain agile, competitive, and prepared to excel in an ever-evolving construction landscape.
Acknowledgement
An older version of the “Effects of Disruption on Performance” model was influenced by Baker, J. P., & Durrant, P. (2008). “Effect of competence during different modes of operation”, Figure 2 in Developing and maintaining competence – Experiences from the rail industry. In 2008 3rd IET International Conference on System Safety (pp. 1-6). Available from https://www.rpd.co.uk/docs/Developing_and_maintaining_competence.pdf, last accessed July 8, 2025. The model has since evolved to incorporate additional taxonomies, a polarity and a time-wise direction.
Further reading
- Evans-Greenwood, P., Hillard, R., & Williams, P. (2019). Digitalizing the construction industry: A case study in complex disruption. Deloitte Review, 25, 98-119. Available from https://www2.deloitte.com/us/en/insights/topics/digital-transformation/digitizing-the-construction-industry.html, last accessed July 8, 2025.
- Katsaliaki, K., Galetsi, P., & Kumar, S. (2022). Supply chain disruptions and resilience: A major review and future research agenda. Annals of Operations Research, 319(1), 965-1002. Available from https://link.springer.com/article/10.1007/s10479-020-03912-1, last accessed July 8, 2025.
- Maskuriy, R., Selamat, A., & Aliyu, A. (2021). Facilitating digital transformation in construction – A systematic review of the current state of the art. Frontiers in Built Environment, 7, 660758. Available from https://www.frontiersin.org/journals/built-environment/articles/10.3389/fbuil.2021.660758/full, last accessed July 8, 2025.
- Taleb, N. N. (2012). Antifragile: Things that gain from disorder. Random House. Available from https://www.penguinrandomhouse.com/books/176227/antifragile-by-nassim-nicholas-taleb/, last accessed July 8, 2025 (behind a paywall).
- Osuizugbo, I. C., Oyeyipo, O., Olumide, A. O., & Abiola-Falemu, J. O. (2020). Disruptive technological innovations in construction field and fourth industrial revolution intervention in the achievement of the sustainable development goal 9. International Journal of Construction Management, 22(15), 2946-2954. Available from https://www.tandfonline.com/doi/full/10.1080/15623599.2020.1819522, last accessed July 8, 2025.
- Teece, D., Pisano, G., & Shuen, A. (1997). Dynamic capabilities and strategic management. Strategic Management Journal, 18(7), 509-533. Available from https://onlinelibrary.wiley.com/doi/10.1002/(SICI)1097-0266(199708)18:7%3C509::AID-SMJ882%3E3.0.CO;2-Z, last accessed July 8, 2025.
Cite as: BIMe Initiative (2025), 'Episode 26: Effects of Disruption on Performance', https://bimexcellence.org/thinkspace/episode-26-effects-of-disruption-on-performance/. First published 9 July 2025. Viewed 1 May 2026
Excellent article! It clearly explains how disruption affects performance and offers a practical model that professionals can actually use — a real contribution to the BIM field. I especially appreciate how it encourages leaders to build resilience into their teams and workflows. Well done and looking forward to more!
Excellent article! It clearly explains how disruption affects performance and offers a practical model that professionals can actually use — a real contribution to the BIM field. I especially appreciate how it encourages leaders to build resilience into their teams and workflows. Well done and looking forward to more!
Thank you Dr. Ahmed!
Thank you Dr. Ahmed!