
Jump
Published on November 25, 2025 | Last Updated on January 18, 2026
This BIMthinkSpace episode introduces Adaptive Maturity, a practical way to understand how well an organisation can respond to performance disruption. The concept combines two dimensions that strongly influence performance during disruptive change:
- Adaptive Capacity: how quickly and effectively an organisation reacts to challenges or opportunities; and
- Process Maturity: how clearly its workflows are defined, managed, and improved.
When these two dimensions are mapped together, they reveal four Adaptive Maturity States - Stagnant, Chaotic, Dynamic, and Rigid. Each State describes a typical pattern of behaviour that explains why some organisations handle disruption well while others struggle.
This episode focuses on the foundations: what the two dimensions mean, how they interact, and why they matter. It introduces diagnostic models that help change agents [1] understand why organisations adopt different responses to the same technological or market shifts, why some improve quickly, others fall behind, and many sit somewhere in between.
Finally, the episode positions Adaptive Maturity among well-known management and innovation frameworks. By comparing it with models such as Diffusion of Innovation and Dynamic Capabilities, it clarifies how Adaptive Maturity contributes something distinct: a way to assess the internal conditions that allow an organisation not just to adopt innovations, but to thrive on disruptions and scale their benefits.
Introduction
The construction industry continues to navigate an unprecedented wave of technological disruption, driven by the accelerating adoption of Large Language Models (LLMs) and the impending proliferation of autonomous agents and equipment. While some organisations will successfully harness these disruptions to achieve significant improvements in productivity, others will experience inconsistent results - gaining efficiencies from one deployment while suffering inefficiencies in others.
To avoid or minimise these discrepancies, a change agent must move beyond simply implementing new tools; they need to understand and systemically improve an organisation’s underlying ability to respond to such disruptions.
Building on the Episode 26 - where an organisational response was categorised as either adaptive (leading to performance elevation or recovery) or nonadaptive (resulting in stagnation or decline) - this episode uncovers Adaptive Capacity. This new concept represents an organisation’s potential to respond appropriately to challenges and opportunities as they arise, encompassing its agility, resilience, vitality, and culture.
However, capacity alone is insufficient without structure. Therefore, Adaptive Capacity is mapped against a second key concept: Process Maturity. This clarifies how well organisational systems are defined, managed, and integrated to sustain and improve performance over time.
The intersection of these two concepts yields a matrix of four quadrants - the Adaptive Maturity States - that explain (and eventually [2]) how different organisations will weather performance disruptors.
This episode addresses two primary questions:
- What is meant by Adaptive Maturity and how does it relate to Process Maturity?
- Why are the four Adaptive Maturity States critical to understanding - and improving - responsiveness to disruption?
Important: The Adaptive Maturity model is the culmination of more than two decades of digital transformation consulting and digital maturity assessments delivered across more 20+ countries. The patterns captured in Adaptive Maturity reflect recurring strengths, weaknesses, and behaviours observed in organisations of different sizes, sectors, and cultural contexts. These real-world insights provided the empirical grounding needed to formalise the concepts presented in this episode.
To fully benefit from this article, readers need to be familiar with the topic of BIM/Digital Maturity (Episodes 13 and 21) at different Organisational Scales, and preferably read the BIM Maturity at Scale document recently published by the National Research Council Canada (NRC, 2025). Researchers can also review the Conceptual Hierarchy, the Conceptual Reactor, and the summarised LITE Framework’s research methodology (Succar and Poirier, 2020, Figure 1) that are applied in developing the new models. Finally, for educators and trainers, this article offers reflections and questions to expand discussions with students and trainees. Where applicable, sources are cited or quoted, with additional peer-reviewed reading materials provided at the end of this article.
What is Adaptive Maturity?
Adaptive Maturity integrates multiple concepts into a single model for understanding performance and responsiveness to disruption.
Performance Disruption and Responsiveness
A Performance Disruption within an organisation is any event that significantly impacts its performance causing a positive or negative change in productivity, quality, efficiency, or similar metrics. Depending on the disruption experienced or anticipated, an adequate response requires (a) deploying existing, improved, or new abilities (e.g. acquiring a new software tool), (b) initiating, accelerating, or completing specific activities (e.g. delivering training), and/or (c) developing, refining, or possibly abandoning specific outputs (e.g. a redundant product or inefficient service). These responses may yield a variety of commercial, social, or environmental outcomes that - when evaluated - can be judged to be adaptive (i.e. disruption was identified then mitigated through adequate measures leading to performance improvement/recovery) or nonadaptive (i.e. disruption wasn’t identified or was met with ineffective actions resulting in stagnation or decline in performance). What causes a response to be adaptive or not adaptive relies on the intersection of Adaptive Capacity with Process Maturity.
Adaptive Capacity
Adaptive Capacity (AC) is a complex set of abilities that allows an entity[3] to “continuously design and develop solutions to match or exceed the needs of their environment as changes in that environment emerge” (Lee, Vargo and Seville, 2013). Adaptive Capacity typically refers to the “elements that make up the culture of an organisation and that allow it to make decisions in both a timely and appropriate manner in a crisis and to identify and maximise opportunities” (McManus, 2008). These elements[4] can be best described as a combination of agility (speed of action/response), resilience (ability to recover/rebound from a negative disruption), vitality (energy available to respond), and culture (shared assumptions, values, and norms shaping the response behaviour). That is, the ability of an organisation to adaptively respond to disruption – the organisational Adaptive Capacity – combines the following four complementary components (Table 1):
- Organisational Agility (OA) - the ability of an organisation to rapidly adapt and respond to changes in market conditions, and customer needs. OA encompasses a range of practices, structures, and cultures that enable an organisation to change course quickly, innovate, and seize new opportunities while managing risks effectively (McKinsey, 2015) (Nguyen et. al. 2024).
- Organisational Resilience (OR) - the “ability of an organization to absorb and adapt in a changing environment” (ISO, 2017) and “how an organization can prepare and build persistent advantages in uncertain times” (Nayab & Kaalsaas Dahl, 2023). OR enables an organisation to recover from (negative) disruption while continuing to achieve intended outcomes.
- Organisational Vitality (OV) - the sustained energy that drives an organisation, circulates through its people, processes, and culture, and is maintained through a combination of Learning, Innovation, Flexibility and Entrepreneurship (“LIFE” pillars). OV fuels adaptability in the face of change, reflecting both realised and motivational strengths. This vitality is measured by enthusiasm, knowledge flow, and the ability to transform purpose into action (Bishwas & Sushil, 2016).
- Organisational Culture (OC) - the system of shared assumptions, values, and norms shaping an organisation’s collective behaviour and decision-making. OC typically (a) reflects the leadership’s values; (b) evolves over time based on internal and external pressures; and is (c) taught to new members as the expected way to think and behave (Schein, 2010; Cameron & Quinn, 2011). OC serves as the framework that (d) either enables and/or constrains organisational agility, resilience and vitality; and (e) guides how an organisational mission is internalised by staff, how risks and opportunities are framed, and how strategic goals are translated into everyday practices.
Table 1. Organisational Adaptive Capacity – adaptive components
| Organisational Agility (OA) | Organisational Resilience (OR) | Organisational Vitality (OV) | Organisational Culture (OC) | |
|---|---|---|---|---|
| Question it answers | Can the organisation change course quickly and effectively to benefit from performance disruptions? | Can the organisation withstand the (negative) performance disruptions, recover, or bounce back? | Does the organisation have the energy to repeatedly respond to performance disruptions? | Would the organisation’s common values and norms promote the mind-sets and behaviours that support OR, OA, and OV? |
| Time it applies | Before and during performance disruptions | During and after performance disruptions | Across performance disruption cycles (pre-, during, and post-disruption) | Across performance disruption cycles (pre-, during, and post-disruption) |
| Core mechanisms | Resource fluidity and process flexibility | Redundancy, robustness, and antifragility | Communicative, motivational, and supportive climate (covers Learning, Innovation, Flexibility, and Entrepreneurship (LIFE) routines) | Shared assumptions, values, norms, and reinforcement mechanisms (selection, socialisation, sanctioning) |
| Typical KPIs | Decision-cycle time and time-to-market | Recovery time and service-level stability | Employee satisfaction, R&D budget pipeline, and idea-to-launch ratios | Culture-fit, psychological-safety, value-alignment, and cultural-entropy[5] |
These adaptive components are positively correlated yet are in dynamic tension: focusing on agility (fast pivots when faced with disruption) without strengthening resilience (robust buffers against disruption) risks burnout (decrease in vitality/regenerative energy thus eroding performance); while focusing on resilience ossifies processes and inhibits agile responses. Also, maximising vitality risks complacency by maintaining high morale at the expense of implementing unpopular, yet necessary business decisions (e.g. mandating minimum onsite attendance hours or removing redundant roles). Maintaining the tension by balancing these components is thus essential to avoid costly trade-offs, with organisational culture playing an essential calibrating role.
In other words, while organisational vitality supplies the ‘renewable human energy’ necessary to respond to disruptions, organisational agility channels that energy into rapid responses, and organisational resilience ensures organisations can absorb shocks during challenging circumstances. A healthy organisational culture guarantees that agility is swift rather than frantic, resilience is elastic rather than brittle, and vitality is deeply energising rather than superficial. When appropriately balanced, the four components enable a measured and repeatable adaptive response to all types of disruption.
Reflection 1: This Episode uses the term ‘Adaptive Capacity’ rather than ‘Adaptive Capability’. Capability refers to the ability to perform activities and deliver desired outcomes, such as an organisation with trained engineers in BIM software tools and Large Language Models. Capacity goes further, encompassing capability plus the necessary resources, managerial intent, and cultural norms for effective action and delivery. Simply put, capability is knowing what to deliver and how to perform, while capacity is being empowered, and having the resources to do both.
Question 1: In your organisation, where have resources been allocated to capability development (e.g. new hardware acquisition or software training) without corresponding investments in capacity-building measures - such as workflow adjustments, leadership alignment, or project budget allocation - that are necessary to fully realise the intended benefits?
The Adaptive Capacity Index
Adaptive Capacity is a nonbinary concept and is better expressed through a multi-level Adaptive Capacity Index (ACI). In its simplest form, ACI is a five-scale measurement device applicable to entities at different organisational scales:
Level 0 (Resistant): Entities are inflexible, unable to adapt to any disruption, and rely on rigid, immutable processes.
Level 1 (Receptive): Entities acknowledge disruption yet react in a non-calibrated or inconsistent manner.
Level 2 (Responsive): Entities respond to disruption in a mostly coordinated, coherent, and timely manner.
Level 3 (Reformative): Entities rapidly adjust their structures, strategies, and processes to accommodate disruption.
Level 4 (Regenerative): Entities anticipate disruption by continuously preparing, adapting, learning and innovating.
While ACI applies at different entity scales (e.g. a single organisation or a whole supply chain), the Organisational Adaptive Capacity Index (OACI) is further elaborated in Table 2 below:
Table 2. Organisational Adaptive Capacity Index – with diagnostic clues and common analogies
| ACI Level | Description (culture cues italicised) | Diagnostic clues | Common analogies | |
|---|---|---|---|---|
| 1 | Resistant (Low AC) |
The organisation is inflexible, relying on rigid, immutable processes; no redundancies, recovery routines or AR Signals[6]; decision pathways are either unclear or paralyzingly bureaucratic; the culture is defensive, blame-oriented, suppresses curiosity and punishes dissent | Denial; tool-blaming; negligible R&D budget; obsolete SOPs; many single points of failure across the system | “I can’t see it affecting us”; “It’s a fad”; “change is a dirty word” |
| 2 | Receptive (Medium-Low AC) |
The organisation recognises disruption but reacts inconsistently; resilience is brittle; agility flickers as few change champions clash with a risk-averse majority; vitality sparks then dissipates; AR Signals are weak | Chronic postponement; patch-over-root-fixes; disconnected pilots; recovery plans only on paper; champions roam the alleys but improvements don’t stick | “We see it… maybe tomorrow”; “We’re busy cutting down trees, sharpening the axe will have to wait” |
| 3 | Responsive (Medium AC) |
The organisation responds in a coordinated, timely manner though adaptation is still sporadic; a learning-oriented culture emerges, cross-team trust rises, and lessons begin to circulate | Organised yet episodic fixes; guides are in use but lessons not always learned; blaming tools and externalities starts to fade | “Contain the fire before it spreads”; “Fix only what needs fixing, and do it fast” |
| 4 | Reformative (Medium-High AC) |
The organisation rapidly re-tools systems and processes (one-off rapid restructuring in response to disruption); psychological safety is high; experimentation is normalised and failures mined for insights; resilience is elastic, agility adaptive, vitality amplified (LIFE pillars in concert) | Structural pivots; standing cross-functional squads; regular re-tooling and re-training; curiosity budgets protected | “Fix the plane mid-flight”; “It’s ok to experiment, just don’t overdo it” |
| 5 | Regenerative (High AC) |
The organisation anticipates disruption and converts it into advantage; a purpose-driven culture encourages exploration and values diversity of thought; resilience is antifragile, agility perpetual, vitality self-renewing | Anticipatory experiments; exploration formally budgeted; lessons instantly re-embedded; performance baseline rises post-crisis; stories of past pivots celebrated organisation-wide | “We are in perpetual beta mode”; “Do not play it safe”; “Keep that what-if mindset alive!” |
The five levels describe how an organisation’s response to a disruptor may range from highly resistant - operating through rigid and outdated processes - to highly proactive, anticipating disruption, encouraging innovation, and continuously evolving. As organisations fluctuate through these levels, they become better or less equipped to survive and thrive in a disruption-rich landscape (e.g. within an environment affected by continuous technological transformation). However, to explain how an organisation’s adaptive response may lead to improved performance, its adaptive behaviour needs to be mapped against its process maturity. This is necessary because - as extensively discussed in peer-reviewed research - mature organisations are better able to respond to disruptions, maintain performance improvements and compound them into higher levels of efficiency and productivity (Nasiri, Saunila, & Ukko, 2022) (He, Huang, Choi & Bilgihan, 2023) (Vial, 2019) (Robertson, Botha, Walker, Wordsworth & Balzarova 2022) (Weritz, Braojos, Matute & Benitez, 2024).
What is Process Maturity
Process maturity refers to the degree to which an entity’s practices, workflows, and activities are explicitly defined, managed, integrated, and continuously optimised in a consistent and measurable manner. Here, the term process is one part of the Technology, Process, and Policy trilogy (Succar, 2009), the foundational fields for establishing readiness and capability across organisational scales. The evaluation of a process centres on how effectively its aggregate activities are codified (e.g. repeatable steps are available in well-tested lists, templates, and process maps); automated by employing automatic and autonomous systems (Succar and Poirier, 2020); controlled using explicit role definitions and permission structures; and monitored with systematic measurement and feedback mechanisms.
High process maturity thus denotes an organisation’s ability to consistently deliver outcomes - even under challenging conditions - due to established and institutionalised operations rather than reliance on ad-hoc practices or individual contributions. Conversely, low process maturity suggests that performance is contingent upon personal initiative, improvisation, or informal solutions, resulting in variable outcomes and limited scalability.
Process Maturity Index
To assess the maturity of technologies, processes or policies with precision and accuracy, the index used must be consistent irrespective of industries, domains and organisational sizes. That is, when focusing on processes, the Process Maturity Index must rely on the same underlying Maturity Index used to assess technology within organisations (see Episode 13) or policies across markets (Episode 21). As clarified in Table 3, the same five levels ranging from Ad-hoc/Initial (Low Maturity), through Defined (Medium Maturity), Managed (Medium Maturity), Integrated (Medium-High Maturity), and lastly to Optimised (High Maturity), can be accurately used to assess a variety of maturity topics. This is exemplified in the below table that demonstrates how the same Maturity Index is equally applicable when measuring training delivery at an engineering firm or even ordering a meal at a restaurant.
Table 3. Process Maturity Index applied to different domains – simplified
| Maturity Level | Simplified definition | Engineering Firm – Training Scenario | Restaurant – Ordering Food Scenario | |
|---|---|---|---|---|
| a | Initial/Ad-hoc (Low Maturity) |
Absence of documentation or systems; processes and outcomes are inconsistent | Symptom: employee requests training that may or may not be received depending on undeclared or changing factors Cause: training policy not set and/or training budget not allocated |
Symptom: restaurant visited on Monday, Pizza Margherita ordered, tasted good. On Thursday, however, the same reordered pizza tasted differently Cause: different chefs worked on Monday/Thursday; pizza recipes not available; each chef used a different proportion of ingredients |
| Remedy: training policy developed including time/budget allocations; employees now receive training as per policy | Remedy: unify and communicate pizza recipes; Pizza Margherita now tastes the same every day irrespective of who prepared it | |||
| b | Defined (Medium-Low Maturity) |
Documentation exists; processes are clarified and outcomes specified (inconsistency drops) | Symptom: new project required custom competences; when the manager asks “who received training?”, no answer is available or investigation takes hours Cause: no training manager or learning management system (LMS) |
Symptom: restaurant visited again but no clean table available although several are empty Cause: front of house isn’t managed properly; no clear responsibility for table cleaning |
| Remedy: an LMS is deployed; competence levels and training efforts are logged; competent employees can be quickly identified and allocated | Remedy: a manager is appointed to improve front-of-house services; empty tables now cleaned immediately | |||
| c | Managed (Medium Maturity) |
Systems exist; processes and outcomes are managed and monitored by a proficient actor (human or machine); consistency achieved | Symptom: new employee starts, but two days later manager discovers induction training not delivered; HR then notified Cause: recruitment and training procedures handled by separate systems with no linkage |
Symptom: family sits at a clean table and orders via QR code; manager arrives later saying restaurant ran out of basil Cause: front and back of house systems not connected; missing items not flagged in the app |
| Remedy: integrated system implemented; new recruit start date now triggers automated actions across training, IT, etc. | Remedy: integrated ordering + back-of-house system deployed; low-stock items now flagged as “not available” in the app | |||
| d | Integrated (Medium-High Maturity) |
Managed systems are integrated, increasing efficiency and reducing waste | Symptom: training delivery worked until most staff began working from home; new recruits stopped receiving induction training Cause: long-term shift to hybrid work conditions |
Symptom: after many successful years, patronage drops Cause: demographic changes; older patrons reluctant to use phones/QR ordering |
| e | Optimised (High Maturity) |
Integrated systems are continuously improved | Remedy: induction training moved online with training kits mailed as needed; hybrid training system continually calibrated | Remedy: restaurant introduces tablet menus; services and offerings updated regularly based on feedback and research |
Note: The Restaurant – Ordering Food Scenario is available as an illustration here.
As clarified in Table 3, an increase in "maturity" within any domain reflects a shift from lower to higher levels indicating (i) better control through minimising variations between targets and actual results, (ii) better predictability and forecasting by lowering variability in performance and costs, and (iii) greater effectiveness in reaching defined goals and setting new more ambitious ones (Lockamy & McCormack, 2004) (McCormack, Ladeira, & Oliveira, 2008).
Reflection 2: Maturity assessment is often confused with gap analysis where ‘maturity levels’ are represented by a generic scale (1 to 5, or low to high). Such generic scales often indicate a different progression in maturity for each topic being assessed (e.g. the same ‘maturity level’ could mean an increase in quantity, quality, satisfaction or similar). A robust maturity assessment must use well-defined levels that indicate the exact same stepped progression irrespective of the topic being assessed.
Question 2: Think of a time you participated in a maturity survey or assessment. Did the results provide immediate clarity and a clear path forward, or did they spark arguments about the meaning of “Level 3” rather than discussion covering how to improve? What happens to an organisation's change momentum when the tools meant to provide clarity create confusion instead?
Combining the concepts into new models
As discussed in the previous sections, there are many concepts that need to be applied to understand responsiveness to disruption. These are unified below into a single model combining Adaptive Capacity and Process Maturity into Adaptive Maturity (AM). AM is presented below as a matrix (Table 4) and then clarified further through a set of Visual Knowledge Models.
Table 4. Adaptive Maturity Matrix (at Granularity Level 1 - highest values are bottom-right)
| ACI \ PMI | (a) Ad-hoc | Low PM | (b) Defined | Med-Low PM | (c) Managed | Medium PM | (d) Integrated | Med-High PM | (e) Optimised | High PM |
|---|---|---|---|---|---|
| (1) Resistant Low AC |
a1 | Ad-hoc Resistant: Frequent improvisation while retaining inefficient legacy routines; no responses to disruption and no learning from mistakes; practices replicated without reflection; risks unseen and requests for change unheard; innovation champions and incentives absent |
b1 | Defined Resistant: Procedures documented then treated as scripture; no responses or learning; practices locked into rigid templates; risks unseen; unyielding gatekeepers block change; deviations rejected; new ideas dismissed; absence of incentives prevents champions from emerging |
c1 | Managed Resistant: Management enforces strict conformity to legacy methods; no learning beyond memorising directives; risks unseen or dismissed; change efforts stalled; management preserves order without improvement |
d1 | Integrated Resistant: End-to-end workflows welded together by prescriptive procedures; dashboards monitor variance only to keep things unchanged; learning restricted; risks unrecognised; change requests die in multilayer sign-off loops |
e1 | Optimised Resistant: A machine-like organisation with consistent output but fossilised practices; no willingness to pivot; efficiency masks fragility; risk signals ignored; change forcibly blocked; a brittle system liable to collapse under disruption |
| (2) Receptive Med-Low AC |
a2 | Ad-hoc Receptive: Disruptions acknowledged but responses non-systemic and slow; learning imitative; risks still largely unseen; complacency dampens change; fixes forgotten after crises; occasional champions surface but unsupported |
b2 | Defined Receptive: Documented processes stabilise work yet limit change to timid tweaks; disruptions prompt incremental adjustments; learning brief, lessons seldom learned; risk partially acknowledged; champions pilot improvements but momentum fades |
c2 | Managed Receptive: Management tracks disruptions and issues instructions; responses activated on command; learning copies prior fixes; risk acknowledged but mitigated minimally; every change requires approval; improvement momentum depends on supervision |
d2 | Integrated Receptive: Committees centrally monitor disruptions; responses follow rigid scripts; learning imitates past fixes; risks logged but thinly analysed; change passes through long bureaucratic corridors |
e2 | Optimised Receptive: Controlled improvements show flickers of agility; disruptions acknowledged through norms; responses follow tested paths; learning optimises prior fixes; risk noted but under-analysed; small silo changes accepted; transformation seldom implemented |
| (3) Responsive Medium AC |
a3 | Ad-hoc Responsive: Disruptions trigger organised yet limited responses; agility appears in short bursts; learning based on repetition; disrupted practices restored rather than redesigned; risk no longer ignored; adaptive responses tolerated if imitating past actions; long-term improvements stall |
b3 | Defined Responsive: Guides tweaked after disruptions; agility flares briefly; resilience rises modestly; learning iterative but precedent-bound; risk given cursory analysis; change nudged rather than re-engineered; improvements short-lived |
c3 | Managed Responsive: Management reacts with agility; learning iterative and cumulative; controlled pilots scale based on evidence; risk-opportunity reviews precede decisions; improvements become rhythmic and confidence grows |
d3 | Integrated Responsive: Cross-functional teams operate under a shared roadmap; pivoting fast and coordinated; learning iterative; practices synchronised; risk-opportunity reviews structured; approval gates remain hard |
e3 | Optimised Responsive: Closed-loop controls optimise operations in near-real time; learning iterative and synchronised; risk-opportunity balance maintained; preparedness embedded; new rules adopted after whole-system testing |
| (4) Reformative Med-High AC |
a4 | Ad-hoc Reformative: Disruption sends the energetic organisation in many directions; learning exploratory; practices reinvented frequently; risk-taking tolerated; change chased hastily; cohesion formed around wins but not institutionalised |
b4 | Defined Reformative: Manuals rewritten after disruptions; agility proactive; learning exploratory; risk-taking tolerated; change championed; momentum evaporates when champions leave |
c4 | Managed Reformative: Management proactive and adaptive; learning exploratory and shared; practices re-engineered; calculated risk welcomed; transformations roadmap-guided; progress still project-based |
d4 | Integrated Reformative: Interconnected teams coordinate swift responses; exploratory collaborative learning; rapid-feedback loops redesign practices; calculated risks welcomed; lightweight structures steer progress |
e4 | Optimised Reformative: Integrated teams use rapid-feedback cycles to redesign practices; proactive, adaptive responses standard; lessons implemented immediately; calculated risk encouraged; improvements spread rapidly |
| (5) Regenerative High AC |
a5 | Ad-hoc Regenerative: Continuous trialling without capturing lessons; experimentation without application; repeated recombination of knowledge; risk-taking encouraged even without guardrails; progress driven by isolated initiatives |
b5 | Defined Regenerative: Process maps evolve continuously; agility high; learning disciplined and lessons captured; risk hedged; change flows but implementation hampered; progress reliant on champions and informal networks |
c5 | Managed Regenerative: Management sustains linked renewal programmes; adaptive responsiveness habitual; learning experimental and codified; predictive processes counter risk; cadence of change keeps organisation ahead; improvements accelerate but may overlap |
d5 | Integrated Regenerative: Organisation operates as a fluid network; pivots anticipatory; learning codified rapidly; confident risk appetite; lightweight systems sustain continuous improvement |
e5 | Optimised Regenerative: An antifragile organisation that senses, learns and elevates itself autonomously; agility habitual; learning instantly codified; resilience reinforced through real-time recombination; shared purpose and flexible connections sustain renewal |
The Adaptive Maturity Matrix clarifies the granular behaviours and cultural nuances found at each intersection of the two indices. By mapping these twenty-five distinct “microstates”, we can subsequently identify the broader organisational trends - or Adaptive Maturity States - that define how entities respond to disruption.
Adaptive Maturity States
The Adaptive Maturity Dot Matrix (Figure 1) shows the above Adaptive Maturity Matrix (Table 4) using 25 labelled dots (each dot corresponds to a cell in the matrix). The labels start from a1 (low Process Maturity and Adaptive Capacity, at the bottom left) to e5 (high Process Maturity and Adaptive Capacity, at the top right). By analysing the connotations of the 25 cells, several distinct characteristics allow identifying four overlapping clusters (Figure 2), referred to as Adaptive Maturity States, with a distinct collection of microstates: Stagnant State (includes microstates a1-c3), Chaotic State (a3-c5), Dynamic State (c3-e5) and Rigid State (c1-e3). The four Adaptive Maturity States are represented in Figure 3 and their comparative characteristics are summarised in Table 5.
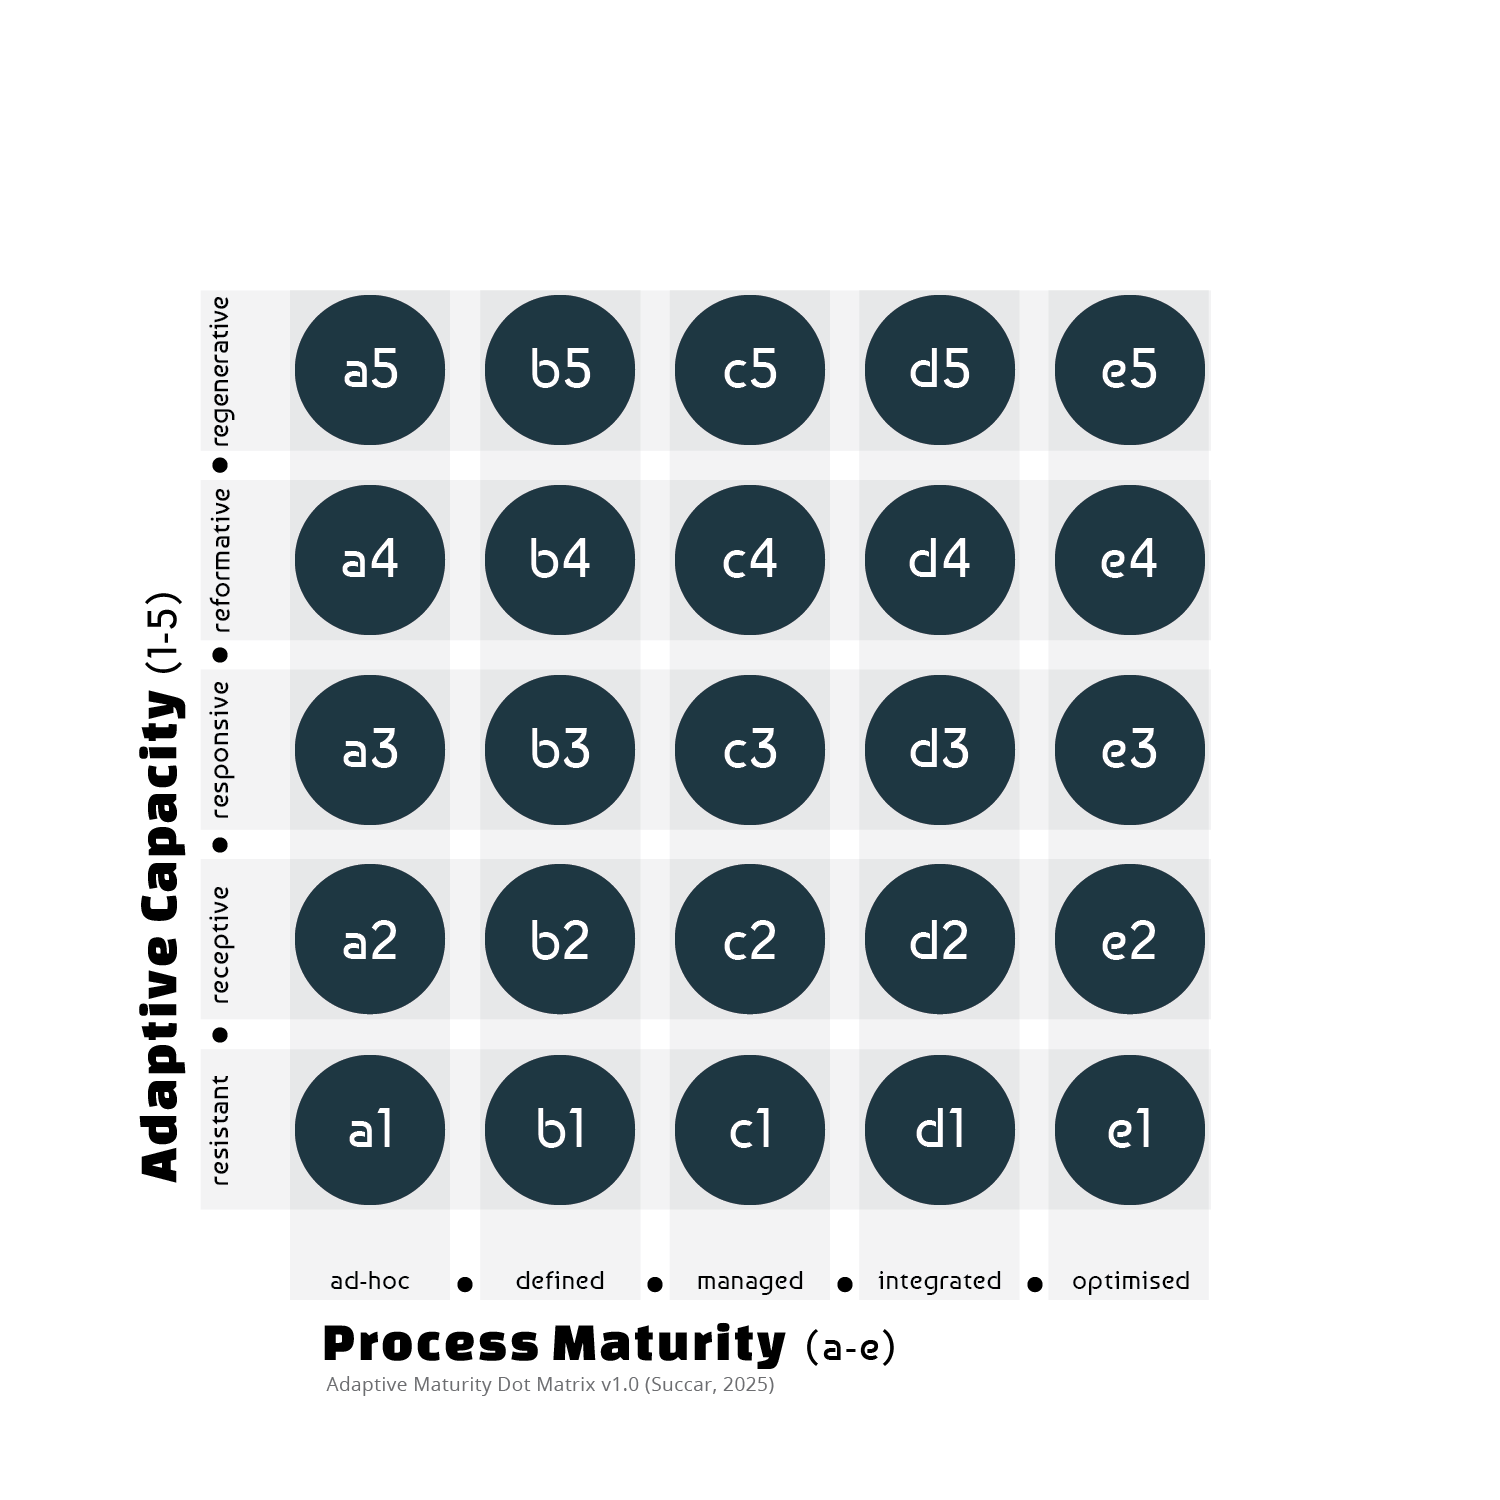
Figure 1. Adaptive Maturity Dot Matrix
This model shows 25 dots representing the Adaptive Maturity microstates formed when mapping the five levels of the Adaptive Capacity Index with the five levels of the Process Maturity Index (highest values are top-right).
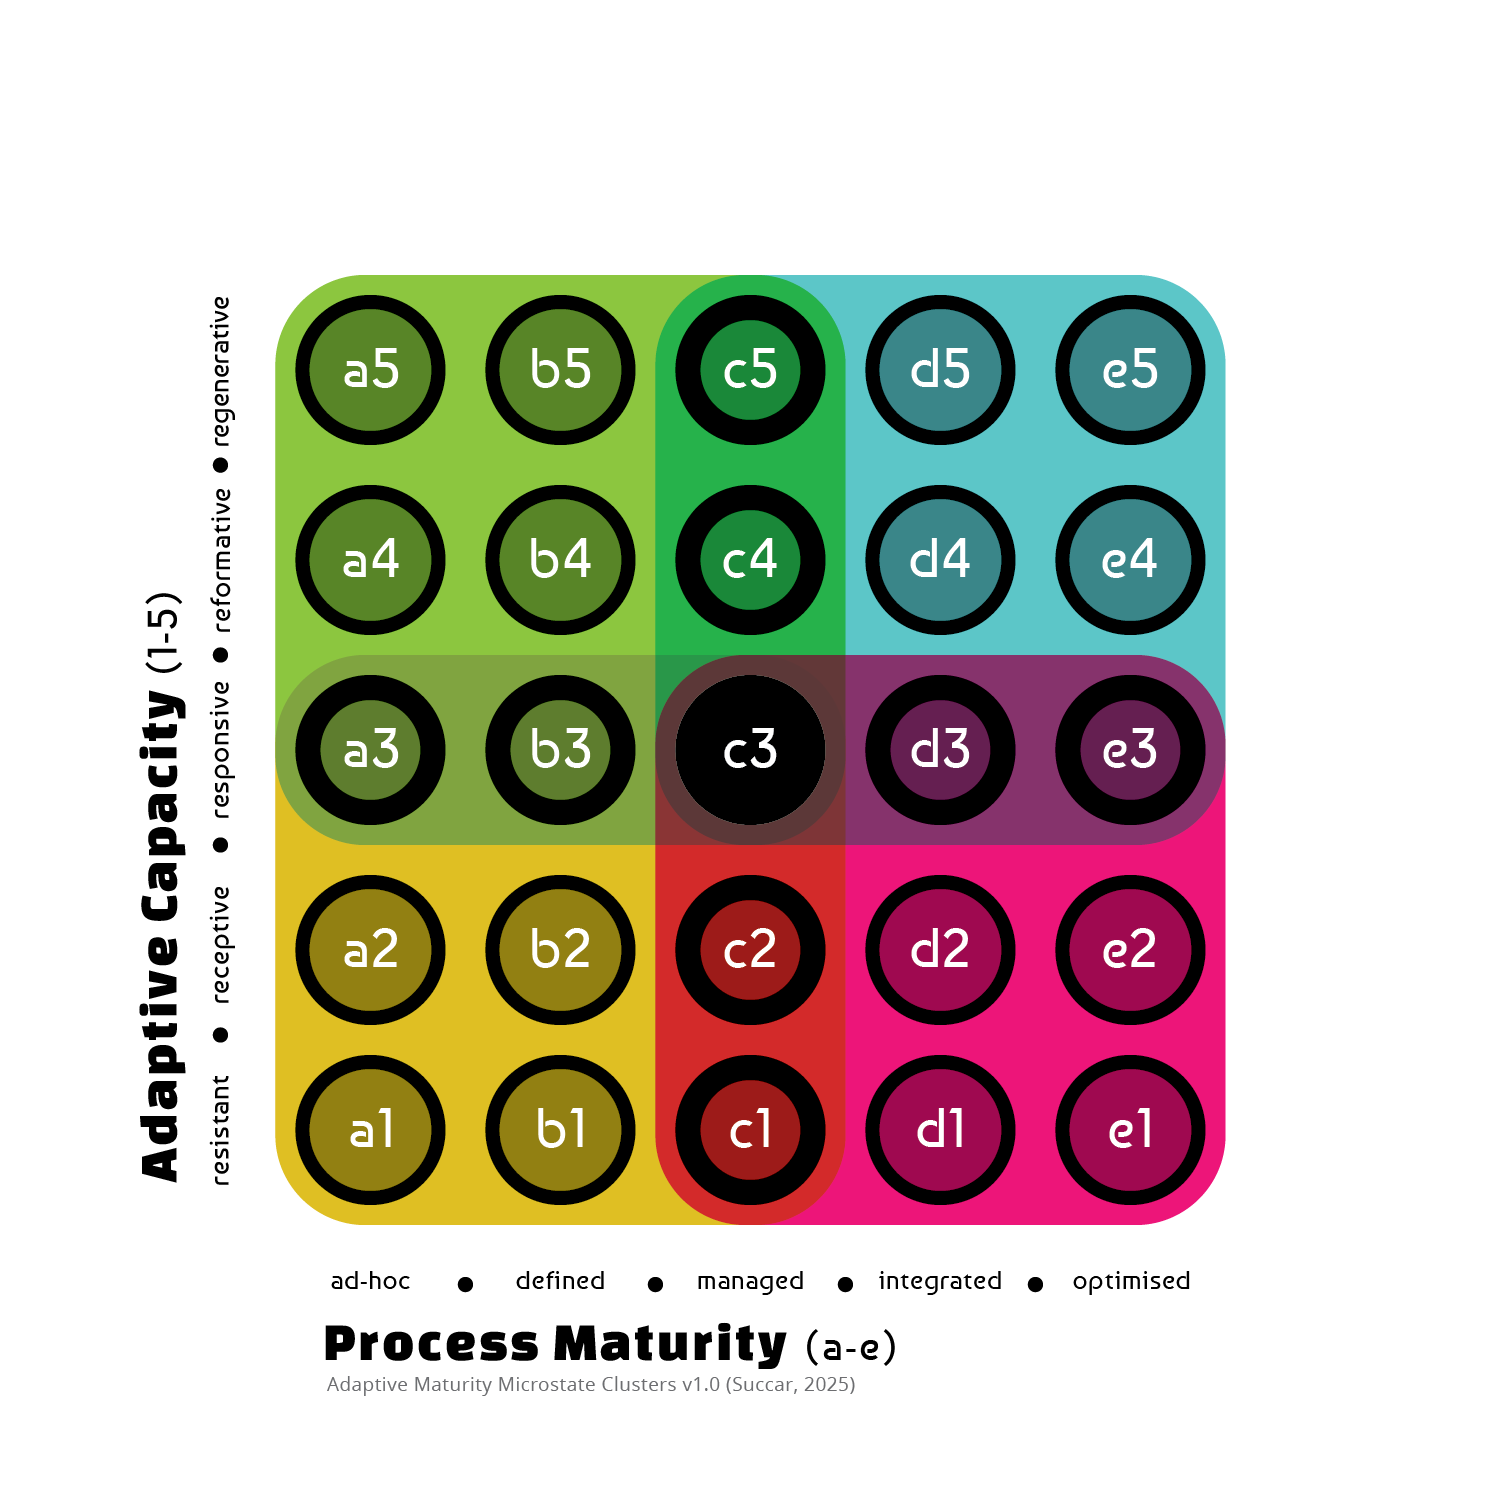
Figure 2. Adaptive Maturity Dot Matrix Clusters
This model shows how the 25 Adaptive Maturity microstate dots are grouped into 4 Adaptive Maturity States, each containing 9 microstates (4 non-overlapping in each State and 3 overlapping between each adjacent States - including 1 overlapping with diagonally opposite States).
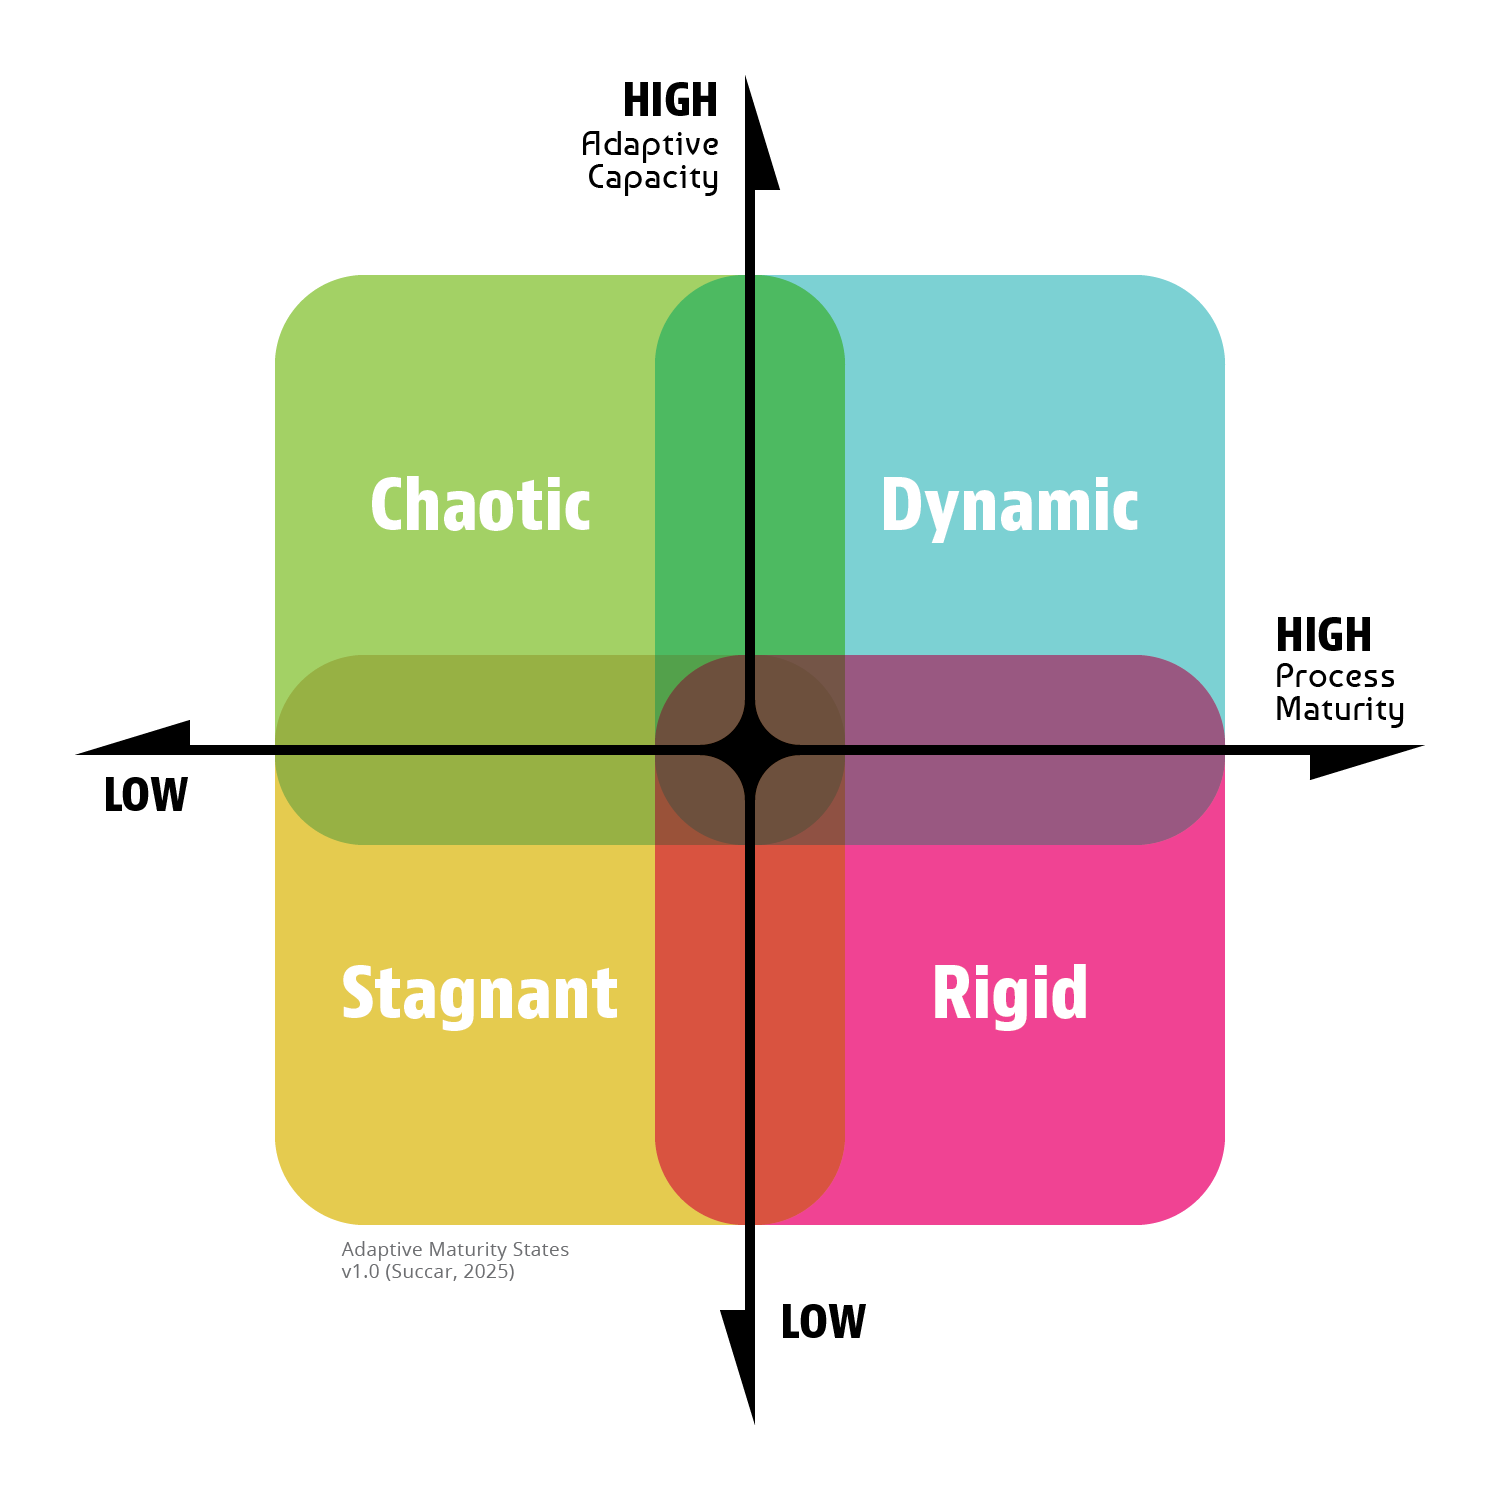
Figure 3. Adaptive Maturity States
Table 5. Adaptive Maturity States – Comparative Characteristics
| Stagnant State [S] | Chaotic State [C] | Dynamic State [D] | Rigid State [R] | |
|---|---|---|---|---|
| Adaptive Capacity | Low | High | High | Low |
| Process Maturity | Low | Low | High | High |
| Responsiveness to +ve disruption (typical) | Nonadaptive | Adaptive | Adaptive | Nonadaptive |
| Responsiveness to -ve disruption (typical) | Nonadaptive | Nonadaptive | Adaptive | Adaptive |
| Agility (response posture) | Inactive | Active | Proactive | Reactive |
| Vitality (learning-innovation behaviour) | Imitative | Exploratory | Innovative | Repetitive |
| Resilience (practice-evolution mode) | Replicating | Reinventing | Customising | Codifying |
| Culture (normative orientation) | Complacent | Unruly | Purposeful | Compliant |
| Risk posture | Risk blindness | Risk-taking | Risk awareness | Risk aversion |
| Change posture | Change resistance | Change eagerness | Change embracing | Change aversion |
| Other organisational traits (specific to organisational scale) | Lack of enabling environment; absence of innovation champions and drivers; little active discourse; no incentive to experiment; no perceived value in pursuing new solutions (“it isn’t broken, why fix it?”); lack of long-term planning (“we’re too busy cutting down trees to replace the axes with chainsaws”) | Prevalence of early tech exploration; multiple pilots with endless hype cycles; lack of norms/standards; divergent or competing approaches; processes hectic, unstructured or fragmented; many champions, no drivers; communication noisy; investments and incentives sporadic | Proven solutions widely adopted; efficient systems prevalent; rules set but applied fluidly (same essence, different forms); communication clear and disciplined; performance continuously reviewed and calibrated | Processes prescriptive, rule-based and uniform; solutions standardised; significant change takes inordinate time; no champions, only drivers; discourse muted; experimentation discouraged; detail-focused debates; decision-making hierarchical or centralised |
To further explain these Adaptive Maturity States, Figure 4 combines the main comparative characteristics from Table 5, and Figure 5 illustrates the overlaps and transitions between States:
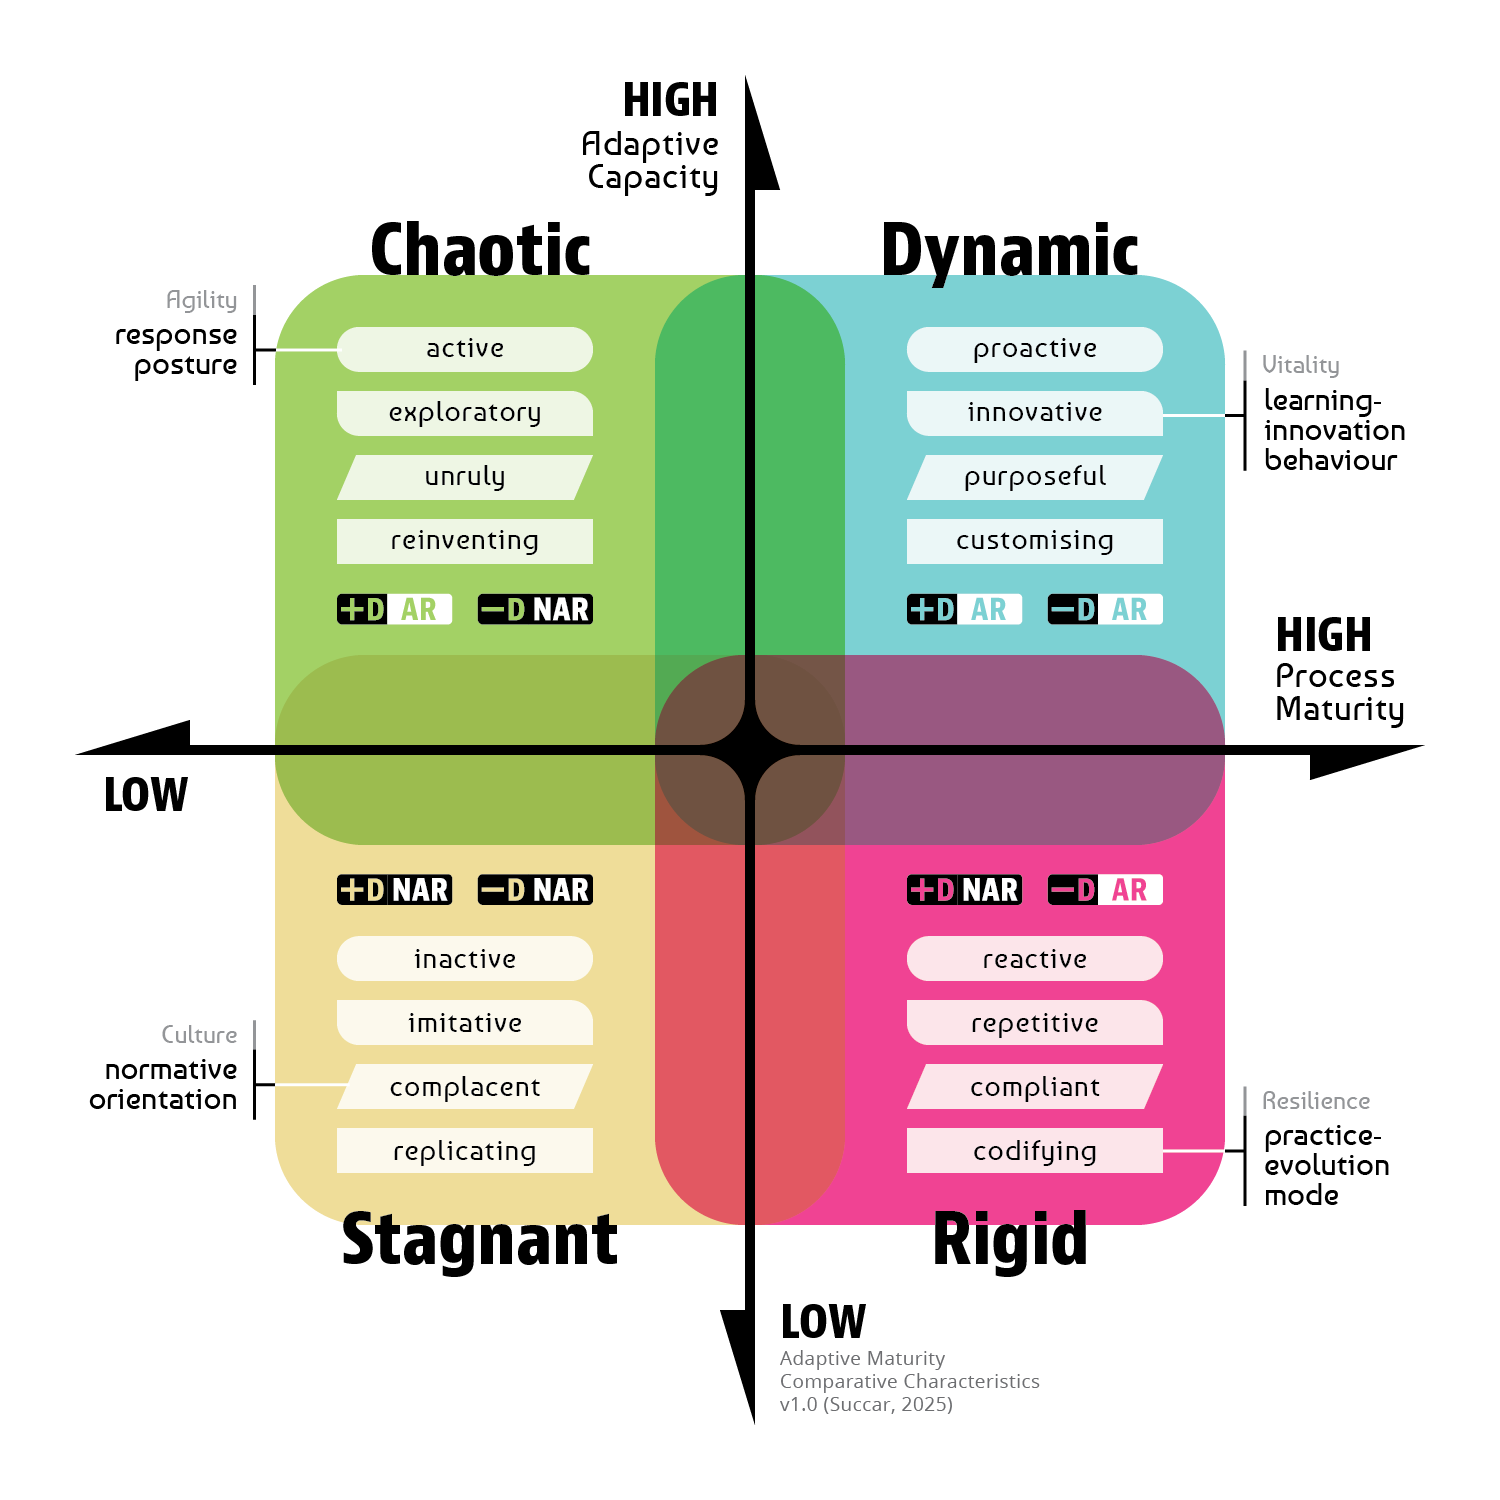
Figure 4. Adaptive Maturity Comparative Characteristics
This model illustrates comparative Adaptive Maturity Characteristics across the four States
+D: Positive Disruption -D: Negative Disruption
AR: Adaptive Response NAR: Nonadaptive Response
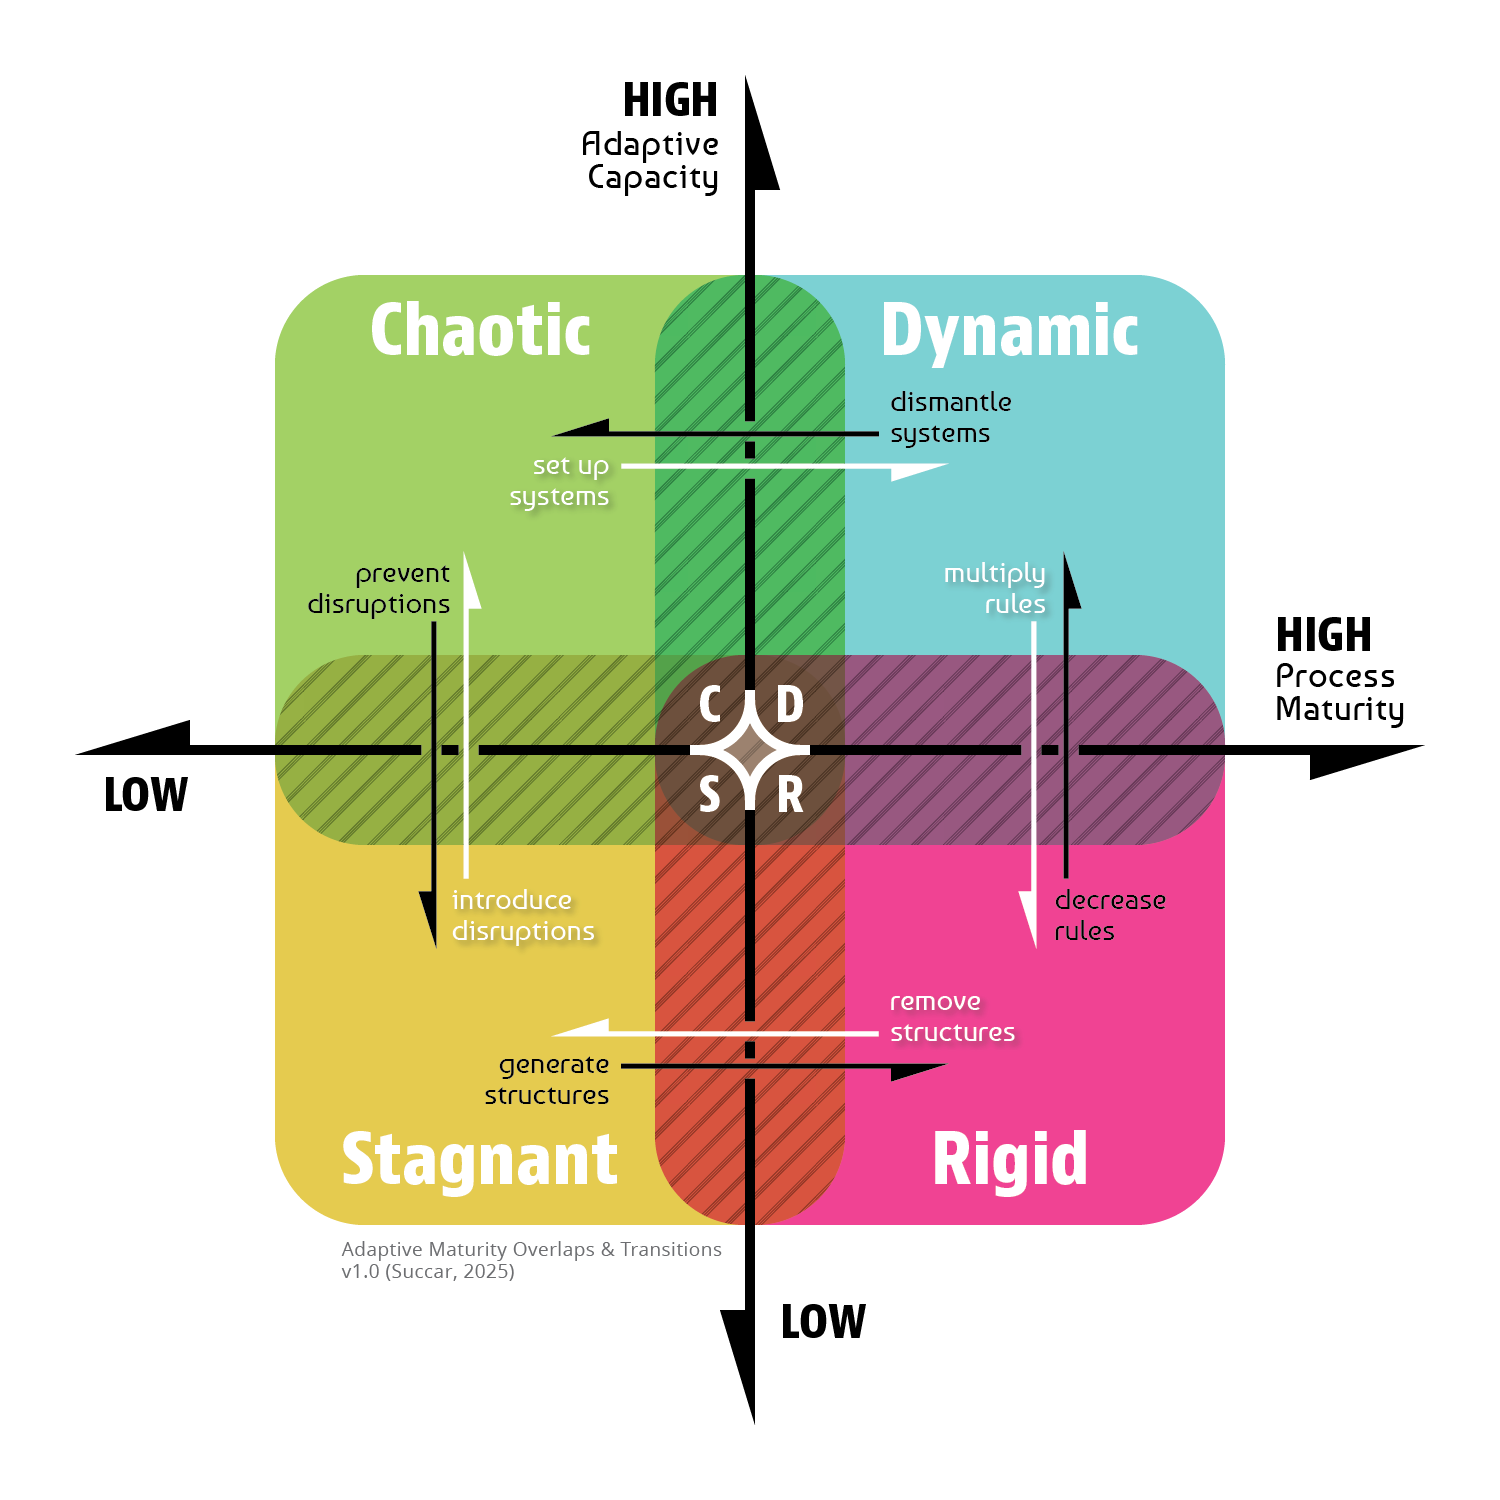
Figure 5. Adaptive Maturity Overlaps and Transitions
This model illustrates the major overlaps between adjacent States, and the minor overlaps between diagonally opposed States. It also illustrations the main transition actions between adjacent States.
State Overlaps
While the four States represent a distinct set of characteristics within an entity (e.g. organisation), there are still some overlaps between them. That is, a Chaotic State [C] will still harbour some elements of Stagnation [S], Dynamism [D] and even Rigidity [R]. Also, an entity in a Stagnant State that has virtually no vitality or established systems may still include some elements of Chaos, Rigidity and – to a lesser extent – Dynamism. This is represented in the Adaptive State Overlap Areas within Figure 5 which illustrate major overlaps – amounting to 3 shared microstates - between adjacent States [SC, CD, DR, and RS] and minor overlaps – one shared microstate - between diagonally opposing States [SD and CR].
Table 6. Adaptive Maturity Overlap Areas
| Overlap Type | Overlapping Microstates | Description / Representation | |
|---|---|---|---|
| Stagnant/Chaotic Overlap [S/C] | Major overlap (3 microstates) | [a3, b3, c3] three low–medium process maturity levels at the Responsive adaptive capacity level | Agile or resilient practices emerge within otherwise stagnant conditions, creating pockets of chaotic experimentation. |
| Chaotic/Dynamic Overlap [C/D] | Major overlap (3 microstates) | [c3, c4, c5] three medium–high adaptive capacity levels at the Managed process maturity level | Chaotic environments begin establishing stable systems that enable more sustained innovation. |
| Dynamic/Rigid Overlap [D/R] | Major overlap (3 microstates) | [c3, d3, e3] three medium–high process maturity levels at the Responsive adaptive capacity level | High-maturity systems remain malleable enough to accommodate both innovation and high standardisation—a balancing act of high and low agility. |
| Rigid/Stagnant Overlap [R/S] | Major overlap (3 microstates) | [c1, c2, c3] three low–medium adaptive capacity levels at the Managed process maturity level | Rigid governance coexists with stagnant behaviours, resulting in procedural compliance without adaptability. |
| Stagnant/Dynamic Overlap [S/D] | Minor overlap (1 microstate) | [c3] the medium adaptive capacity level (Responsive) at the medium process maturity level (Managed) | Mature but static systems are selectively infused with innovative solutions, creating a fragile yet potentially transformative middle ground. |
| Chaotic/Rigid Overlap [C/R] | Minor overlap (1 microstate) | [c3] the medium adaptive capacity level (Responsive) at the medium process maturity level (Managed) | Conflicting governance models and innovation approaches temporarily coexist. |
| Note: the overlap across all States is microstate c3, the Responsive–Managed microstate. | |||
Overlaps between Adaptive Maturity States are transitional and volatile due to strong polar attractions from the high/low ends of adaptive capacity and process maturity. Purposefully maintaining operations in between States requires significant balancing efforts with constant monitoring and adjustment of processes, governance, culture, and resources. Table 7 provides examples of potential scenarios for maintaining operations across Adaptive States - their purposes, methods, and associated risks.
Table 7. Scenarios for maintaining Adaptive State Overlaps
| Overlap Area | Sample Scenario | Purpose / Benefits of Staying in Overlap | Methods to Maintain Overlap | Risks if Balance Fails |
|---|---|---|---|---|
| Stagnant/Dynamic [S/D] | Mid-sized construction consultancy with moderately mature processes and selective innovation pilots | Preserve operational stability while introducing targeted innovation | Limit experimentation to low-risk projects; maintain compliance in core services; adjust governance mechanisms regularly | Drift to full stagnation if innovation slows, or uncontrolled disruptive change if governance loosens |
| Chaotic/Rigid [C/R] | Post-merger engineering alliance combining strict governance from one firm with agile experimentation from another | Keep compliance for mission-critical work while fostering innovation | Maintain standardisation in safety and regulatory processes; run parallel experimental projects; selectively enforce governance | Split in organisational culture; innovation may be stifled, or compliance may erode |
| Chaotic/Dynamic [C/D] | Prefabrication startup with structured manufacturing and a free-form innovation lab | Deliver reliable outputs while retaining innovation speed | Document and monitor core manufacturing; maintain a separate innovation lab; rotate staff between environments | Disruption in output if chaos spreads; innovation stagnation if governance tightens excessively |
| Stagnant/Chaotic [S/C] | Municipality with static processes but occasional bursts of champion-led innovations | Avoid full stagnation while enabling some experimentation | Sponsor small-scale pilots; allow discretionary project-level flexibility; avoid system-wide reform | Risk of innovation fatigue; pilots may fail without scaling, reinforcing stagnation |
| Dynamic/Rigid [D/R] | National infrastructure agency with highly integrated systems that allow selective flexibility for certain projects | Balance reliability of large-scale programmes with innovation in targeted areas | Keep core processes highly standardised; permit experimental methods in pilot or fast-track projects; maintain strong governance | Governance creep may reduce flexibility; unchecked pilots may undermine system integrity |
| Rigid/Stagnant [R/S] | Large facilities management firm with prescriptive processes but low appetite for change | Maintain predictable performance while avoiding compliance breaches | Retain rule-based workflows; introduce occasional efficiency-focused adjustments; monitor performance metrics closely | Complete ossification; inability to respond to market or regulatory changes |
Reflection 3: The four States are cultural attractors with each one generating its own self-reinforcing ‘gravitational pull’. A Rigid organisation attracts and promotes individuals who value rules and compliance, which in turn makes the organisation more rigid. A Chaotic organisation celebrates and rewards champions/heroes rather than systems, which perpetuates a culture of constant crisis that require more heroic interventions. This gravitational pull explains why transitioning from one State to another can be difficult as it requires battling against the very forces that define the organisation's identity.
Question 3: Consider the 'unwritten rules' for career advancement within your organisation or department. Who is more likely to be celebrated and promoted: the 'hero' who consistently saves projects from the brink of chaos, or the 'steward' who meticulously follows and improves processes to prevent chaos from ever occurring? What does your answer reveal about the State of your organisation and what it is – intentionally or unintentionally - trying to preserve?
State Transitions
Organisations are dynamic entities with changing Adaptive Maturity States over their lifespan. These changes may result from mergers/acquisitions, the introduction/loss of charismatic leadership, or in response to overwhelming market factors. For example, the irreplicable loss of a charismatic founder by a construction startup may cause it to lose its vitality resulting in a shift from a mostly chaotic or dynamic State to stagnation (-ve disruptor, nonadaptive response). Conversely, a well-managed introduction of a disruptive technology with adequate systems and support may transition a previously chaotic organisation to a more dynamic State (+ve disruptor, adaptive response).
In addition to transitioning between States, the undercurrents of Adaptive Maturity exist within the States themselves. For example, an organisation operating in a Rigid State may continue to adopt more standards and optimise existing rules, while another operating under chaotic conditions may continue to attract and implement new disruptors. These transitions are represented in Figure 5 and further explained in Table 8 below:
Table 8. Adaptive Maturity Transitions
| Transitions | Main Transition Action | AC shift | PM shift | Sample Actions |
|---|---|---|---|---|
| S → C | Introduce disruptions | ↑ Up | ↕ Possible | Seed multiple pilots; protect curiosity budgets; legitimise exploration |
| S → R | Generate structures | ↕ Possible | ↑ Up | Codify procedures; centralise approvals; mandate uniform templates |
| S → D | Motivate and integrate | ↑ Up | ↑ Up | Establish governance; introduce incentives |
| S ↻ S | Maintain stagnation | ↕ Possible | ↕ Possible | Continuously avoid disruptions or improvements to systems/governance |
| C → S | Prevent disruptions | ↓ Down | ↕ Possible | Freeze changes; halt pilots; remove experimentation budgets |
| C → R | Impose control | ↓ Down | ↑ Up | Add rules; consolidate platforms; introduce hard stage-gates |
| C → D | Set up systems | ↕ Possible | ↑ Up | Unify processes; clarify rules; integrate systems |
| C ↻ C | Maintain chaos | ↕ Possible | ↕ Possible | Continuously introduce disruption without improving governance |
| R → S | Remove structures | ↕ Possible | ↓ Down | Decommission systems without replacement; reduce governance capacity |
| R → C | De-standardise abruptly | ↑ Up | ↓ Down | Disband governance prematurely; lift controls and KPIs without alternatives |
| R → D | Decrease rules | ↑ Up | ↕ Possible | Replace prescriptive rules with principles and action plans; empower teams |
| R ↻ R | Maintain rigidity | ↕ Possible | ↕ Possible | Continuously add more rules and integrate existing systems |
| D → S | Starve systems | ↓ Down | ↓ Down | Remove budgets; disband productive teams; allow attrition of champions |
| D → C | Dismantle systems | ↕ Possible | ↓ Down | Reduce integration; tolerate ad-hoc workarounds; permit tool sprawl |
| D → R | Multiply rules | ↓ Down | ↕ Possible | Add layers of approvals; harden templates; replace principles with checklists |
| D ↻ D | Maintain dynamism | ↕ Possible | ↕ Possible | Continuously integrate innovative solutions while maintaining governance |
Reflection 4: Organisations do not drift between States but are pushed by disruptors. A single, major event – e.g. a merger, a crisis, or a new CEO - can trigger a rapid State transition. More often, the shift is slow and cumulative, driven by a series of “micro-disruptors”. For example, a consistent failure to update legacy software, the gradual loss of key innovators, or a series of small successful pilot projects can build momentum until a tipping point is reached, pushing the organisation into a new State.
Question 4: The Adaptive Maturity model helps explain why different organisations naturally gravitate towards certain states. Startups are often Chaotic because their survival depends on high adaptive capacity - speed, experimentation, and vitality. Public departments are often Rigid because their mandate demands high process maturity - accountability, consistency, and predictability. Neither State is inherently better for all types of organisations as each is a rational response to a different set of pressures and expectations. Considering this, which transition do you believe is more difficult: instilling discipline in an organisation built on “move fast, break things”, or cultivating flexibility in an organisation built on rules?
How does Adaptive Maturity compare to similar models
The Adaptive Maturity model does not exist in a vacuum but complements well-established frameworks covering technology adoption, strategic management, and performance disruption. However, while these frameworks often focus on external market dynamics or broad strategic capabilities, Adaptive Maturity provides the specific, internal diagnostic tools needed to measure an organisation's responsiveness to disruption.
For instance, while the Technology Adoption Lifecycle (Rogers, 1976) and Diffusion of Innovation theory (Rogers, 2002) (Greenhalgh et al., 2004) explain how innovations spread through a market, they do not assess whether a specific organisation has the process maturity to institutionalise them effectively. Similarly, the Disruptive Innovation theory (Christensen, 1997) (Danneels, 2004) powerfully explains why market leaders fail in the face of new technologies, yet it offers fewer insights into the specific internal configurations - such as the clash between rigid processes and low vitality- that make an organisation vulnerable to such failure. Furthermore, strategic tools like PESTEL (Fahey et al., 1981) (Yüksel, 2012) excel at scanning the macro-environment for external risks, but they do not translate these external signals into indicators of internal adaptive capacity.
The model also aligns with and extends frameworks focused on internal strategy. It supports the Dynamic Capabilities framework (Teece, 2007) by making the abstract concepts of sensing, seizing, and transforming opportunities measurable at the organisational level. Likewise, it connects to the Absorptive Capacity theory (Cohen & Levinthal, 1990) - which explores how entities assimilate new knowledge - by clarifying the structural and behavioural enablers that allow this knowledge to be embedded into core operations rather than remaining isolated in pilot projects.
Adaptive Maturity bridges these gaps. It acts as an internally focused diagnostic model that integrates agility, resilience, and vitality with process maturity. It shifts the focus from simply predicting market disruption to preparing the organisation to withstand it. By examining the interplay between an organisation's adaptive capacity and its procedural maturity, change agents can move beyond abstract strategy and measure the specific structural and behavioural attributes that predict success.
Table 9 clarifies the relative specialisation of these frameworks and highlights where the Adaptive Maturity model offers necessary extensions for assessing responsiveness to performance disruption.
Table 9. Comparative frameworks and models (focus on measuring responsiveness to disruption)
| Framework / Model | Core Focus & Mechanisms | Comparative Strengths (where the framework excels) | Comparative Limitations (where the framework lacks focus) | Limitations addressed by the Adaptive Maturity model |
|---|---|---|---|---|
| Technology Adoption Lifecycle & Diffusion of Innovation (Rogers) | Explains how innovations spread through populations; categorises adopters (innovators, early adopters, etc.); focuses on adoption rates and social influence | Widely used for understanding adoption patterns; highlights social dynamics in innovation; provides detailed models of social networks, communication channels, and adoption curves; strong for market forecasting | Does not assess whether organisations can institutionalise or sustain innovations; lacks focus on internal capabilities and process maturity | Adds diagnostic tools for assessing if organisations can embed and sustain innovations, not just adopt them; links adoption to adaptive capacity and process maturity |
| Disruptive Innovation Theory (Christensen) | Describes how new technologies disrupt established firms; focuses on market entry, incumbent response, and failure modes | Explains why successful firms can fail; highlights vulnerability to disruption; deeply analyses market dynamics, competitive strategy, and mechanisms of disruption | Focuses on external threats and market dynamics; gives less attention to internal readiness, resilience, or process maturity | Identifies which internal configurations (e.g. low maturity / high agility) are most vulnerable or resilient; provides indices to measure and improve readiness |
| PESTEL Analysis | Scans macro-environmental factors (Political, Economic, Social, Technological, Environmental, Legal) that may impact organisations | Comprehensive external scanning; helps anticipate external disruptors; exhaustive in categorising external risks and opportunities | Does not translate external risks into actionable internal readiness or capacity; lacks diagnostic tools for internal adaptability | Bridges external scanning with internal assessment; converts external drivers into indicators of adaptive capacity and process maturity |
| Dynamic Capabilities Framework (Teece) | Focuses on an organisation’s ability to sense, seize, and transform opportunities for sustained performance | Emphasises agility, learning, and transformation; links strategy to capability development; offers nuanced strategic management theory and capability evolution | Often abstract; lacks practical diagnostic tools for measuring capabilities at the organisational level; limited integration with process maturity | Makes dynamic capabilities measurable through indices; integrates agility, resilience, and process maturity into a unified diagnostic model |
| Absorptive Capacity Theory (Cohen & Levinthal) | Explores an organisation’s ability to recognise, assimilate, and apply new knowledge | Highlights importance of learning and knowledge integration for innovation; deeply explores learning processes and R&D management | Focuses on knowledge flows but not on broader organisational systems or process maturity; less actionable for diagnosing readiness | Clarifies structural and behavioural enablers for embedding knowledge; links absorptive capacity to process maturity and adaptive capacity for holistic assessment |
Combining Frameworks – Sample Scenario
To illustrate how these models and frameworks interact in practice, let’s consider a City Government (local authority, municipality, or similar) in SE Asia initiating a Digital Models --> Digital Couples --> Smart City program for its public infrastructure. The process begins with the City - using the PESTEL framework – scanning the macro environment to identify regulatory pressures, technological trends in laser scanning/IoT sensors, and social expectations for data access and transparency. This establishes the context. Next, the Disruptive Innovation Theory is applied to forecast the impact of real-time asset management and how it will fundamentally disrupt traditional, paper-based maintenance contracts and static procurement models.
However, knowing the context and impact - and acknowledging that a disruptive storm is coming - is different from being ready to weather it. This is where Adaptive Maturity provides the critical diagnostic filter by turning the focus inward to assess whether the City and its stakeholders are ready for this shift. The City may identify risks including resistance from contractors and staff, and opportunities such as improved lifecycle management and cost savings. The assessment may also reveal an imbalance where one department (e.g. the development team) is highly agile but lacks structure (Chaotic State), while the planning and procurement departments remain locked in rigid, multi-stage approval processes (Rigid State). Recognising this friction, the City invests in building internal capabilities - not just by developing the technology infrastructure, but – by improving its Process Maturity (standardising data governance) and Adaptive Capacity (training cross-functional teams to handle real-time decision-making).
Finally, as the Smart City platform matures into a well-calibrated solution, the City employs the Dynamic Capabilities framework to continuously sense new data partnerships and transform service delivery models, and the key aspects of the Absorptive Capacity theory to ensure that lessons learned from every pilot project are not lost but are embedded into the organisation’s memory and daily practices.
By layering these frameworks, the City transforms external signals into actionable internal improvements with Adaptive Maturity ensuring the organisation is dynamic enough to adequately respond to challenges and opportunities.
In Summary
Adaptive Maturity is more than a theoretical idea; it is a practical way to diagnose how an organisation responds to disruption. When we recognise that every small workflow change acts as a micro-disruption and that major market shifts function as macro-disruptions, the relevance of Adaptive Maturity becomes clear. Its components apply to almost every decision, process, and adjustment an organisation makes.
By combining Adaptive Capacity (agility, resilience, vitality, and culture) with Process Maturity, the model clarifies why some organisations convert disruption into improvement while others repeat the same mistakes or stall under pressure. This intersection allows change agents to look past surface-level symptoms - such as tool failures, delays, or inconsistent performance - and focus instead on the deeper behaviours and system qualities that shape outcomes.
For researchers, the model provides a structured way to analyse why digital transformation efforts often produce uneven results across similar organisations. For practitioners, it offers a realistic reflection of how the organisation actually behaves under strain, rather than how it is assumed or hoped to behave. This clarity is essential for planning meaningful interventions and building the conditions needed to respond to disruption deliberately and consistently.
Next Episode
This episode introduced Adaptive Maturity and mapped its four States - Stagnant, Chaotic, Dynamic, and Rigid. However, how can a change agent pinpoint where an organisation is situated on this map? And more importantly, how can an organisation navigate from Stagnation, Chaos or Rigidity toward a more Dynamic ideal?
Episode 28 will introduce an assessment method and sample assessment tools to measure and improve Adaptive Maturity. To receive a notification for the upcoming episode, please subscribe to the BIMe Initiative mailing list here: https://bimexcellence.org/subscribe/.
References
Endnotes
[1] Change agents are internal champions and external consultants who help organisations to improve their performance.
[2] This post delivers the conceptual foundations that explain, not predict, responsiveness. Predicting responsiveness to performance disruption will be covered in future episodes.
[3] The concepts, metrics, and models discussed in this episode can be applied widely: at different organisational scales such as whole market, supply chains, project team, or single organisation. Even when focusing on organisations, they can be applied at different organisational sizes (from large multi-nationals to micro organisations) operating across any industry or sector– e.g. manufacturing, aerospace, and agriculture. For brevity, Episode 27 will specifically focus on medium-sized, for-profit, private organisations operating within the construction industry (e.g. an engineering firm or general contractor).
[4] McManus identifies different elements/indicators of adaptive capacity - silo mentality; communications and relationships; strategic vision and outcome expectancy; information and knowledge; and leadership, management, and governance structures. These elements are limited in scope and do not cover other aspects similar to agility and vitality which – we argue – are key to truly adaptive response to both positive and negative disruptions.
[5] Cultural Entropy measures organisational dysfunction by quantifying the energy spent on unproductive work, or the effort needed to overcome unnecessary barriers within an organisational culture. Entropy typically arises from misaligned mission statements (e.g. senior managers pushing in two different directions), or when behaviours do not match with stated values. High cultural entropy expresses itself as excessive control, bureaucracy, internal competition, unclear communications, lower engagement, and lack trust.
[6] An Adaptive Response Signal (AR Signal or ARS) refers to the decision or policy action taken by an authority (e.g. a senior manager within a company) that indicates a preference, willingness or commitment to an adaptive response. These signals may be consequential (strong signals, similar to setting an incentives regime or increasing staff training allocation levels) or symbolic (weak signals, similar to verbal encouragements or non-binding announcements).
Cited Articles
- Bishwas, S. K. (2011). Conceptualization of organization vitality based on strategic knowledge management. Global Journal of e-business and Knowledge Management, 7(1), 45-52. Available from https://www.researchgate.net/publication/278031191_Conceptualization_of_Organization_Vitality_based_on_Strategic_Knowledge_Management, last accessed Aug 13, 2025.
- Bishwas, S. K., & Sushil. (2016). LIFE: an integrated view of meta organizational process for vitality. Journal of Management Development, 35(6), 747-764. Available from https://www.researchgate.net/profile/Professor-Sushil-2/publication/305422461_LIFE_an_integrated_view_of_meta_organizational_process_for_vitality/links/59f725010f7e9b553ebd5a0a/LIFE-an-integrated-view-of-meta-organizational-process-for-vitality.pdf, last accessed Jul 15, 2025.
- Christensen, C. M. (1997). The innovator’s dilemma: When new technologies cause great firms to fail. Harvard Business School Press. Available from http://soloway.pbworks.com/w/file/fetch/46695705/The%20Innovators%20Dilemma.pdf, last accessed Aug 13, 2025.
- Cohen, W. M., & Levinthal, D. A. (1990). Absorptive capacity: A new perspective on learning and innovation. Administrative Science Quarterly, 35(1), 128–152. Available from https://www.josephmahoney.web.illinois.edu/BA545_Fall%202022/Cohen%20and%20Levinthal%20%281990%29.pdf, last accessed Aug 13, 2025.
- Danneels, E. (2004). Disruptive technology reconsidered: A critique and research agenda. Journal of Product Innovation Management, 21(4), 246–258. Can be retrieved from https://doi.org/10.1111/j.0737-6782.2004.00076.x, (require institutional access), last checked Aug 13, 2025.
- Fahey, L., King, W. R., & Narayanan, V. K. (1981). Environmental scanning and forecasting in strategic planning—The state of the art. Long Range Planning, 14(1), 32–39. Can be retrieved from https://www.sciencedirect.com/science/article/pii/0024630181901485 (require institutional access), last accessed Aug 13, 2025.
- Greenhalgh, T., Robert, G., Macfarlane, F., Bate, P., & Kyriakidou, O. (2004). Diffusion of innovations in service organisations: Systematic review and recommendations. The Milbank Quarterly, 82(4), 581–629. Available from https://onlinelibrary.wiley.com/doi/10.1111/j.0887-378X.2004.00325.x, last accessed Aug 13, 2025.
- He, Z., Huang, H., Choi, H., & Bilgihan, A. (2023). Building organisational resilience with digital transformation. Journal of Service Management, 34(1), 147-175. Available from https://doi.org/10.1108/JOSM-06-2021-0216, last accessed Jul 20, 2025.
- Lee, A.V., Vargo, J. and Seville, E. (2013). Developing a tool to measure and compare organizations’ resilience. Natural Hazards Review, 14(1), 29-41. Available from https://www.researchgate.net/profile/Erica-Seville/publication/273370397_Developing_a_Tool_to_Measure_and_Compare_Organizations'_Resilience/links/5669f14208ae430ab4f7512d/Developing-a-Tool-to-Measure-and-Compare-Organizations-Resilience.pdf, last accessed Jul 20, 2025.
- Lockamy III, A., & McCormack, K. (2004). The development of a supply chain management process maturity model using the concepts of business process orientation. Supply Chain Management: An International Journal, 9(4), 272-278. Available from https://doi.org/10.1108/13598540410550019, last accessed Jul 20, 2025.
- McCormack, K., Ladeira, M. B., & Oliveira, M. P. V. d. (2008). Supply chain maturity and performance in Brazil. Supply Chain Management, 13(4), 272-282. Available from https://doi.org/10.1108/13598540810882161, last accessed Jul 20, 2025.
- McKinsey (2015). The keys to organizational agility. McKinsey & Company. Available from https://www.mckinsey.com/capabilities/people-and-organizational-performance/our-insights/the-keys-to-organizational-agility, last accessed Jul 15, 2025.
- McManus, S.T. (2008). Organisational resilience in New Zealand. Doctoral dissertation, University of Canterbury. Available from https://core.ac.uk/download/pdf/35459228.pdf, last accessed Jul 22, 2025.
- Nasiri, M., Saunila, M., & Ukko, J. (2022). Digital orientation, digital maturity, and digital intensity: Determinants of financial success in digital transformation settings. International Journal of Operations & Production Management, 42(13), 274-298. Available from https://doi.org/10.1108/IJOPM-09-2021-0616, last accessed Jul 20, 2025.
- Nayab, S. & Kaalsaas Dahl, L. J. (2023). Organizational Resilience and Crisis Management in SMEs. University of Agder. Available from https://core.ac.uk/download/pdf/577836080.pdf, last accessed Jul 15, 2025.
- Nguyen, T., Le, C. V., Nguyen, M., Nguyen, G., Lien, T. T. H., & Nguyen, O. (2024). The organisational impact of agility: a systematic literature review. Management Review Quarterly. Available from https://link.springer.com/article/10.1007/s11301-024-00446-9, last accessed Jul 15, 2025.
- Robertson, J., Botha, E., Walker, B., Wordsworth, R., & Balzarova, M. (2022). Fortune favours the digitally mature: The impact of digital maturity on the organisational resilience of SME retailers during COVID-19. International Journal of Retail & Distribution Management, 50(8/9), 1182-1204. Available from https://doi.org/10.1108/IJRDM-10-2021-0514, last accessed Jul 20, 2025.
- Rogers, E. M. (1976). New product adoption and diffusion. Journal of Consumer Research, 2(4), 290–301. Available from https://www.jstor.org/stable/2488658, last checked Aug 13, 2025.
- Schein, E. H. (2010). Organizational culture and leadership. John Wiley & Sons. Available from https://ia800805.us.archive.org/9/items/EdgarHScheinOrganizationalCultureAndLeadership/Edgar_H_Schein_Organizational_culture_and_leadership.pdf, last accessed Jul 20, 2025.
- Succar, B. (2009). Building information modelling framework. Automation in Construction, 18, 357-375. Available from https://bit.ly/BIMPaperA2, last accessed Aug 18, 2025.
- Succar, B., & Poirier, E. (2020). Lifecycle information transformation and exchange. Automation in Construction, 112, 103090. Available from https://www.academia.edu/download/86230076/j.autcon.2020.10309020220521-1-1t89rhh.pdf, last accessed Jul 20, 2025.
- Succar, B., Jalaei, F., & RazaviAlavi, S. R. (2025). BIM maturity at scale. NRC Canada. Available from https://doi.org/10.4224/40003493, last accessed Jul 18, 2025.
- Teece, D. J. (2007). Explicating dynamic capabilities. Strategic Management Journal, 28(13), 1319–1350. Retrieved from https://escholarship.org/uc/item/2k86c3mf, last accessed Aug 13, 2025.
- Vial, G. (2019). Understanding digital transformation. Journal of Strategic Information Systems, 28(2), 118-144. Available from https://doi.org/10.1016/j.jsis.2019.01.003, last accessed Jul 20, 2025.
- Weritz, P., Braojos, J., Matute, J., & Benitez, J. (2024). Impact of strategic capabilities on digital transformation success. European Journal of Information Systems. Available from https://doi.org/10.1080/0960085X.2024.2311137, last accessed Jul 20, 2025.
- Yüksel, İ. (2012). Developing a multi-criteria decision making model for PESTEL analysis. International Journal of Business and Management, 7(24), 52–66. Available from https://www.ccsenet.org/journal/index.php/ijbm/article/view/20058, last accessed Aug 13, 2025.
Version Control
|
V. |
Description |
Date |
|
1 |
First release |
Nov 27, 2025 |
|
2 |
- Added link to Process Maturity Explainer Image under Table 4 |
Jan 18, 2026 |
|
… |
- |
- |
Cite as: BIMe Initiative (2026), 'Episode 27: Understanding Adaptive Maturity', https://bimexcellence.org/thinkspace/episode-27-understanding-adaptive-maturity/. First published 25 November 2025. Viewed 10 March 2026