
Jump
Published on December 10, 2025 | Last Updated on January 27, 2026
As introduced in Episode 27, the Adaptive Maturity (AM) model is intended to describe, explain, and eventually predict how organisations respond to performance disruptions. These disruptions could be caused by technological innovations (e.g. the diffusion of BIM or LLMs into workflows), supply chain disruptions (e.g. introduction of tariffs) or internal stresses within organisations (e.g. production errors or losing key talent). This episode demonstrates how the model can also guide AM evaluations to achieve two key objectives:
- Determining an organisation’s current Adaptive Maturity State - whether it is Stagnant, Chaotic, Dynamic, Rigid, or somewhere in between.
- Clarifying the organisation’s adaptive readiness - whether it possesses the necessary Adaptive Capacity and Process Maturity to respond effectively to future disruptions.
To address these objectives, two complementary evaluation methods are introduced. The first provides a rapid calculation that identifies an organisation’s Current AM State. The second offers a more detailed assessment to generate an Adaptive Maturity Benchmark, a composite score for comparing comparable organisations or testing the effectiveness of performance improvement efforts. Together, the two methods allow organisations to define their own Target AM State that they aspire to reach, and develop the AM Improvement Pathways towards their performance goals.
This article is the third instalment in the Adaptive Maturity Series. After introducing the foundational concepts in Episode 26 and the AM model in Episode 27, this episode presents evaluation methods, an interactive microtool for rapid AM calculations, and sample AM improvement pathways. It also embeds a few personal reflections, questions, and an invitation to researchers and informed practitioners - as digital transformation continues to accelerate - to help expand our collective understanding of effects of performance disruptions and how best to prepare for it.
Important: This article is supported by data collected over many years and across multiple countries by the assessor.io platform and its predecessor tools (developed by ChangeAgents AEC, Australia). The microtools and sample pathways presented in this article are for illustrative and educational purposes only, and are provided as is under the BIMe Initiative CC BY-NC-SA 4.0 license. If an organisation wishes to conduct a more thorough evaluation or develop a performance improvement plan tailored to their specific requirements, please contact the assessorIO team.
Method 1: Rapid State Designation
Determining an organisation’s current Adaptive Maturity State requires monitoring its inputs, activities and outputs before and after each performance disruption. At high Levels of Evidence (LoE), such efforts are time-consuming and reliant on the organisation’s willingness to disclose its processes to specialised consultants.
Alternatively, it is possible to conduct a less intrusive internal evaluation using Adaptive Maturity Indicators (AMIs) - a logical group of clues - that can paint a rich picture without forensic evidence. While this picture won't be complete [1], it can still provides useful insights into an organisation's Adaptive Maturity and thus help it to plan basic performance improvement activities.
In this episode, we present 13 key AMIs (Table 1) with descriptions, examples, sample evidence (what to look for), and a five-level scoring index to quickly evaluate each indicator. Using these 13 AMIs, a change agent [2] can calculate basic AM scores that clarify where an organisation is positioned on the Adaptive Maturity spectrum (Figure 2).
Table 1. Adaptive Maturity Indicators (13 key AMIs)
| Code | AMI Title | Axis | AMI Description | Importance | Evidence example | Evidence sources | Evaluation Actions (Scoring Criteria) | Scoring Indices [Higher Scores promote specific Adaptive State(s)] | State(s) Promoted |
|---|---|---|---|---|---|---|---|---|---|
| AMI-1 | Clarity of processes | PMI | The degree to which important activities are defined, documented, and consistently followed | Without process clarity, responses to disruption rely on individual competence, reducing reliability | A construction firm has a uniform procedure for handling design changes, so any site can follow it without confusion. | Process maps, templates, and workflow tools | Extent to which important activities are documented, current, and consistently followed across the organisation (e.g. last update ≤12 months; adherence rate ≥90%) | 1 – No documented processes exist 2 – Some processes documented but outdated or rarely followed 3 – Most key processes documented but used inconsistently 4 – All key processes are documented, current (≤ 12 months old), and followed by most teams 5 – All key processes are documented, updated at least annually, embedded in daily work, and monitored for ≥ 90% adherence |
Dynamic, Rigid |
| AMI-2 | Signal-to-action speed | ACI | How quickly the organisation acts when disruption is detected (detection + decision + first action) | Fast action prevents minor issues from developing into major crises | An engineering team identifies a defect in a digital model and fixes it within hours, avoiding costly rework | Incident/change logs, meeting notes, and project tracking systems | Average time from detecting a significant issue or opportunity to taking the first meaningful action, compared to agreed internal target timeframes (e.g. median response ≤3 days for priority issues) | 1 – Signal not detected 2 – Signal detected, no decision made to respond within timeframes (e.g. ≤ 3 days for priority issues) 3 – First action taken within target timeframes for less than 25% of cases 4 – First action taken within target timeframes in 50% of cases 5 – First action taken within target timeframes in at least ≥ 75% of cases |
Dynamic, Chaotic |
| AMI-3 | Ability to sustain improvements | ACI | Whether adaptive responses introduced during a disruption are sustained and diffused over time | Sustaining and wider diffusion of adaptive responses improves resilience and efficiency | After introducing remote working in a crisis, the organisation keeps refining it into a permanent, productive option | Change management records and audit reports | Percentage of implemented changes that remain in place and continue to deliver intended benefits after a review period (e.g. ≥75% sustained for 6–12 months) | 1 – No changes sustained with improvements abandoned quickly 2 – Fewer than 25% of improvements last until the review period 3 – Around 50% of improvements last until the review period 4 – At least 75% of improvements last until the review period 5 – At least 90% of improvements last until the review period |
Dynamic |
| AMI-4 | Energy for change | ACI | The level of enthusiasm and proactive effort shown during times of disruptive change (behavioural) | High vitality fuels willingness and ability to adapt | Staff volunteer ideas for a new service after seeing a competitor’s success | Staff engagement surveys and participation rates in change initiatives | Level of voluntary participation, initiative, and positive engagement during change, compared to normal operations; who gets involved and how often (e.g. ≥50% staff participation in change initiatives) | 1 – Widespread resistance with no visible enthusiasm for change 2 – Occasional enthusiasm from a small minority 3 – Mixed enthusiasm with about half of staff engaging actively 4 – Most staff show enthusiasm and voluntary participation in change 5 – High, sustained enthusiasm across teams, with ≥ 50% of staff voluntarily initiating or leading change activities |
Dynamic, Chaotic |
| AMI-5 | Speed of recovery | ACI | How quickly the organisation returns to prior or higher performance standards after a negative disruption | Faster recovery reduces the long-term impact of disruption | A cyberattack is contained and systems are restored within hours with minimal data loss | Performance reports, post-incident reviews, service-level reports, and Recovery Time Objectives (RTO) | Time taken to return to agreed service levels, output targets, or performance standards after a disruption (e.g. ≥80% of recoveries meet planned timeframes) | 1 – Recovery is not achieved or takes far longer than planned 2 – Recovery achieved within planned timeframes less than 25% of the time 3 – Recovery achieved within planned timeframes in about half of cases 4 – Recovery achieved within planned timeframes in at least 75% of cases 5 – Recovery achieved within planned timeframes in ≥ 90% of cases |
Dynamic |
| AMI-6 | Learning from experience | PMI + ACI | How well lessons from successes or mistakes are captured and applied | Embedding lessons prevents repeated mistakes and accelerates improvement | A project post-mortem identifies a scheduling tool that worked well, and it is then adopted across all teams | Lessons-learned registers and updated manuals | Proportion of lessons or insights captured that are embedded into standard practices, tools, or processes (e.g. ≥60% embedded within 3 months) | 1 – No lessons are captured or applied 2 – Lessons captured informally but rarely applied 3 – Lessons captured and sometimes applied to similar work 4 – Lessons routinely applied to improve processes and tools 5 – ≥ 60% of captured lessons are embedded into standard practice within 3 months |
Dynamic |
| AMI-7 | Openness to ideas | ACI | Willingness of leaders and teams to try new approaches | Encourages agility and innovation, avoiding stagnation | A manager approves their subordinate’s suggestion to trial a new digital workflow | Suggestion scheme records and pilot project registers | Frequency and proportion of new suggestions, proposals, or pilot initiatives trialled and, if successful, adopted into normal practice (e.g. ≥40% of proposals reach trial stage) | 1 – New proposals are dismissed or ignored 2 – New proposals are vetted and accepted but with no clear trial process 3 – ≥ 25% of accepted proposals reach trial stage 4 – ≥ 50% of accepted proposals reach trial stage 5 – ≥ 90% of accepted proposals reach trial stage |
Dynamic, Chaotic |
| AMI-8 | Shared purpose | ACI | How clearly staff understand, agree with, and can articulate organisational goals and values (cognitive alignment) | A shared purpose improves coordination and decision-making, especially under disruptive pressures | In a sudden market shift, all departments rally around a clear strategy to retain clients | Staff surveys and communications | Degree to which staff can accurately describe organisational goals and values and align work decisions with them (e.g. ≥90% correct responses in staff survey) | 1 – Goals and values are unknown to most staff 2 – Goals and values are known by some staff but rarely referenced 3 – Most staff can describe goals and values but inconsistently apply them 4 – Goals and values are well understood and often referenced in decisions 5 – ≥ 90% of staff can clearly articulate goals and values and link them to their daily work |
Dynamic |
| AMI-9 | Balanced risk-taking | ACI | How well risks are identified, discussed, and managed without stalling improvement initiatives | Supports innovation while avoiding reckless behaviour | A new product is launched in stages, with safeguards to limit losses if it fails | Risk registers and decision meeting minutes | Extent to which identified risks are assessed and acted upon in a way that manages threats without blocking beneficial initiatives (e.g. documented risk treatment in ≥90% of key decisions) | 1 – Risks are ignored or avoided entirely 2 – Risks are discussed occasionally in ≥ 25% of key decisions 3 – Risks are assessed in ≥ 50% of key decisions 4 – Risks are assessed and documented in ≥ 75% of key decisions 5 – Risks are consistently assessed, documented, and managed in ≥ 90% of key decisions |
Dynamic |
| AMI-10 | Coordination across teams and boundaries | PMI + ACI | How effectively different parts of the organisation work together or with external partners during disruptive change | Improves efficiency and accelerates adaptation and implementation | HR, IT, and office managers coordinate their activities to onboard new hires seamlessly | Project plans, coordination meeting notes, and integration logs | Frequency and effectiveness of cross-team and cross-boundary collaboration during projects or change activities (e.g. ≥75% of projects meet joint deadlines) | 1 – Teams operate in silos without internal or external coordination 2 – Occasional coordination in ≥ 25% of cases across internal teams and external partners 3 – Coordination occurs in ≥ 50% of cases across internal teams and external partners 4 – Effective coordination in ≥ 75% of cases across internal teams and external partners 5 – Effective coordination in ≥ 90% of cases across internal teams and external partners |
Dynamic |
| AMI-11 | Preparedness for change | PMI | How much the organisation plans and invests in readiness for disruption | Reduces shock and allows smoother transitions | The budget includes funds for training on new technology | Training plans, budget allocations, and scenario planning documents | Presence and execution of plans, resources, and training for expected disruptions (e.g. funded readiness plans in ≥80% of strategic initiatives) | 1 – No planning or resources for upcoming change 2 – Minimal planning for ≥ 25% of foreseeable changes 3 – Planning covers ≥ 50% of foreseeable changes 4 – Planning, budgeting, and training in place for ≥ 75% of foreseeable changes 5 – Planning, budgeting, and training in place for ≥ 90% of foreseeable changes |
Dynamic, Rigid |
| AMI-12 | Flexibility of resources | ACI | How easily resources – staff, equipment, and budgets – can be reallocated in response to disruptions | Flexibility supports rapid adaptation during disruptions | Competent staff are quickly reassigned from a finished project to one in crisis | Budget allocation data, HR movement logs, and equipment transfer records | Ability to reallocate people, equipment, or funding to meet changing priorities (e.g. redeployment completed in ≤5 days in ≥70% of cases) | 1 – Resources cannot be redeployed without major effort 2 – Redeployment possible but slow with significant effort in ≥ 25% of cases 3 – Redeployment possible within acceptable time in ≥ 50% of cases 4 – Redeployment possible within acceptable time in ≥ 75% of cases 5 – Redeployment possible within acceptable time in ≥ 90% of cases |
Dynamic, Chaotic |
| AMI-13 | Clarity of communication | ACI | How clearly and consistently high-quality information is shared during, before, and after performance disruptions | Maintains trust and alignment between stakeholders, avoiding confusion | During a system upgrade, weekly updates keep all staff informed on progress and impact | Communication plans and feedback surveys | Timeliness, clarity, quality, and consistency of information shared during disruptive change; comprehension by staff; bidirectional flows (e.g. ≥85% of staff rate communications as clear and timely) | 1 – Communication during change is unclear, late, or absent 2 – Clear communication occurs occasionally in about ≥ 25% of change situations 3 – Clear, timely communication in about half of change situations 4 – Clear, timely communication in ≥ 75% of change situations, with some feedback 5 – Clear, timely, and consistent communication in ≥ 85% of change situations |
Dynamic |
| Legend: PMI = Process Maturity Index; ACI = Adaptive Capacity Index; PMI + ACI = Composite indicator (half score to each axis) | |||||||||
To apply these indicators in evaluating Adaptive Maturity, the first step is to assign a score to each AMI (refer to Table 1 and Figure 1) and then compute the Axis Scores. The Average PMI is calculated using all PMI-specific AMIs plus half the scores from the composite indicators (AMI-6 and AMI-10). Similarly, the Average ACI is derived from all ACI-specific AMIs plus half of the composite scores, as shown in Table 2.
The second step uses these two average scores to plot the organisation's status on a 5x5 Adaptive Maturity Matrix grid (PMI on the x-axis and ACI on the y-axis), thereby determining its current Adaptive Maturity State (Figure 2).
Table 2. AMI Scoring – State Designation
| PMI | ACI | State / Overlap | Descriptor | Focus AMIs |
|---|---|---|---|---|
| 1 | 1 | Stagnant | No maturity or adaptability; organisation operates reactively without consistency | 1, 2, 4, 5, 8, 11 |
| 1 | 2 | Stagnant | Low maturity and adaptability; performance may occasionally but temporarily improve | 1, 3, 4, 5, 6, 11 |
| 1 | 3 | Stagnant/Chaotic | Some adaptability exists, but lack of structure causes inconsistent results | 1, 6, 10, 11 |
| 1 | 4 | Chaotic | Adaptable but completely unstructured; success depends on individual initiative | 1, 6, 10, 11 |
| 1 | 5 | Chaotic | Highly adaptable yet process-free; vulnerable to inconsistency and rework | 1, 6, 10, 11 |
| 2 | 1 | Stagnant | Minimal structure and no adaptability; rigid habits despite poor process quality | 1, 2, 4, 5, 8, 11 |
| 2 | 2 | Stagnant | Low structure and low adaptability; basic operations are inconsistent | 1, 2, 5, 8, 11 |
| 2 | 3 | Stagnant/Chaotic | Adaptability occasionally appears but is undermined by weak processes | 1, 6, 10, 11 |
| 2 | 4 | Chaotic | Strong adaptability in some areas but no consistent frameworks | 1, 6, 10, 11 |
| 2 | 5 | Chaotic | Very high adaptability, no structure; resilience comes from people not systems | 1, 6, 10, 11 |
| 3 | 1 | Stagnant/Rigid | Processes starting to emerge but adaptability absent; prone to over-reliance on routine | 2, 3, 4, 5, 7, 12 |
| 3 | 2 | Stagnant/Rigid | Some process maturity but low agility; change is resisted or slow | 2, 3, 4, 5, 8, 12 |
| 3 | 3 | Balanced Low | Basic structure and adaptability; can handle minor changes, struggles with major ones | 3, 5, 6, 9, 12 |
| 3 | 4 | Stagnant/Chaotic Overlap | Moderate agility but process weaknesses cause inconsistent results | 1, 6, 10, 11 |
| 3 | 5 | Chaotic | High adaptability, moderate processes; may waste effort due to uncoordinated work | 1, 6, 10, 11 |
| 4 | 1 | Rigid | Stronger processes emerging but little flexibility; risk of stagnation | 2, 3, 4, 5, 7, 8 |
| 4 | 2 | Rigid | Solid processes but slow or resistant to change; priorities take too long to shift | 2, 3, 4, 5, 7, 9 |
| 4 | 3 | Balanced Mid | Structure and adaptability balanced at mid-level; capable of handling routine disruptions | 3, 5, 7, 9, 12 |
| 4 | 4 | Overlap (Rigid/Dynamic) | Well-structured and adaptable, but could strengthen speed or consistency | 2, 4, 5, 8, 12 |
| 4 | 5 | Dynamic | Highly adaptable with solid processes; could refine learning and coordination | 3, 6, 9, 10, 12 |
| 5 | 1 | Rigid | Fully developed processes but no agility; organisation is locked into fixed patterns | 2, 3, 4, 5, 7, 9, 12 |
| 5 | 2 | Rigid | Very strong processes but limited adaptability; risks irrelevance under change | 2, 3, 4, 5, 7, 8, 12 |
| 5 | 3 | Overlap (Rigid/Dynamic) | Excellent processes and moderate adaptability; can adapt but slower than leaders | 2, 3, 4, 5, 7, 9 |
| 5 | 4 | Dynamic | High-performing processes and strong adaptability; well-prepared for most disruptions | 3, 4, 5, 8, 12 |
| 5 | 5 | Dynamic | Optimal structure and adaptability; resilient, fast, and consistent under any change | 3, 4, 5, 8, 12 |
Sample Organisation
As an example of how this method can be applied to determine the Adaptive Maturity State, a hypothetical organisation is assessed below (Table 3) using the 13 key AMIs. Sample score are provided to clarify how scores are calculated.
Table 3. Method 1 Scoring Results - sample organisation
| Code | AMI Title | Axis | AMI Score | ACI share | PMI share |
|---|---|---|---|---|---|
| AMI-1 | Clarity of processes | PMI | 4.5 | 0 | 4.5 |
| AMI-2 | Signal-to-action speed | ACI | 3.5 | 3.5 | 0 |
| AMI-3 | Ability to sustain improvements | ACI | 4.0 | 4.0 | 0 |
| AMI-4 | Energy for change | ACI | 4.5 | 4.5 | 0 |
| AMI-5 | Speed of recovery | ACI | 3.5 | 3.5 | 0 |
| AMI-6 | Learning from experience | PMI + ACI | 4.0 | 2.0 | 2.0 |
| AMI-7 | Openness to ideas | ACI | 4.0 | 4.0 | 0 |
| AMI-8 | Shared purpose | ACI | 4.5 | 4.5 | 0 |
| AMI-9 | Balanced risk-taking | ACI | 3.0 | 3.5 | 0 |
| AMI-10 | Coordination across teams and boundaries | PMI + ACI | 4.0 | 2.0 | 2.0 |
| AMI-11 | Preparedness for change | PMI | 3.5 | 3.5 | 3.5 |
| AMI-12 | Flexibility of resources | ACI | 4.0 | 4.0 | 0 |
| AMI-13 | Clarity of communication | ACI | 4.5 | 4.5 | 0 |
| SUM | 40.5 | 12.0 | |||
| COUNT | 11 | 4 | |||
| AVERAGE | 3.68 | 3.00 |
As shown in Table 3, the averaged assessment results for the sample organisation is a score of 3.00 on the Process Maturity Index (PMI) and 3.68 on the Adaptive Capacity Index (ACI). To determine the organisation's State, these scores are mapped onto the 5x5 Adaptive Maturity Matrix. The PMI score of 3.0 corresponds to column 'c' (Managed) and the ACI score of 3.68 - rounded to the nearest whole number - corresponds to row '4' (Reformative). This places the organisation in the microstate c4: Managed Reformative.
As shown earlier in the Adaptive Maturity Dot Matrix Clusters (Episode 27, Figure 1), the c4 microstate is in the Chaotic/Dynamic Overlap. This indicates an organisation with high adaptive energy and innovative potential that may be in the process of developing the mature systems needed to make its performance consistent and scalable.
For additional clarity, the raw AMI scores and resulting positioning of the sample organisation are illustrated in Figure 1 and Figure 2 below:
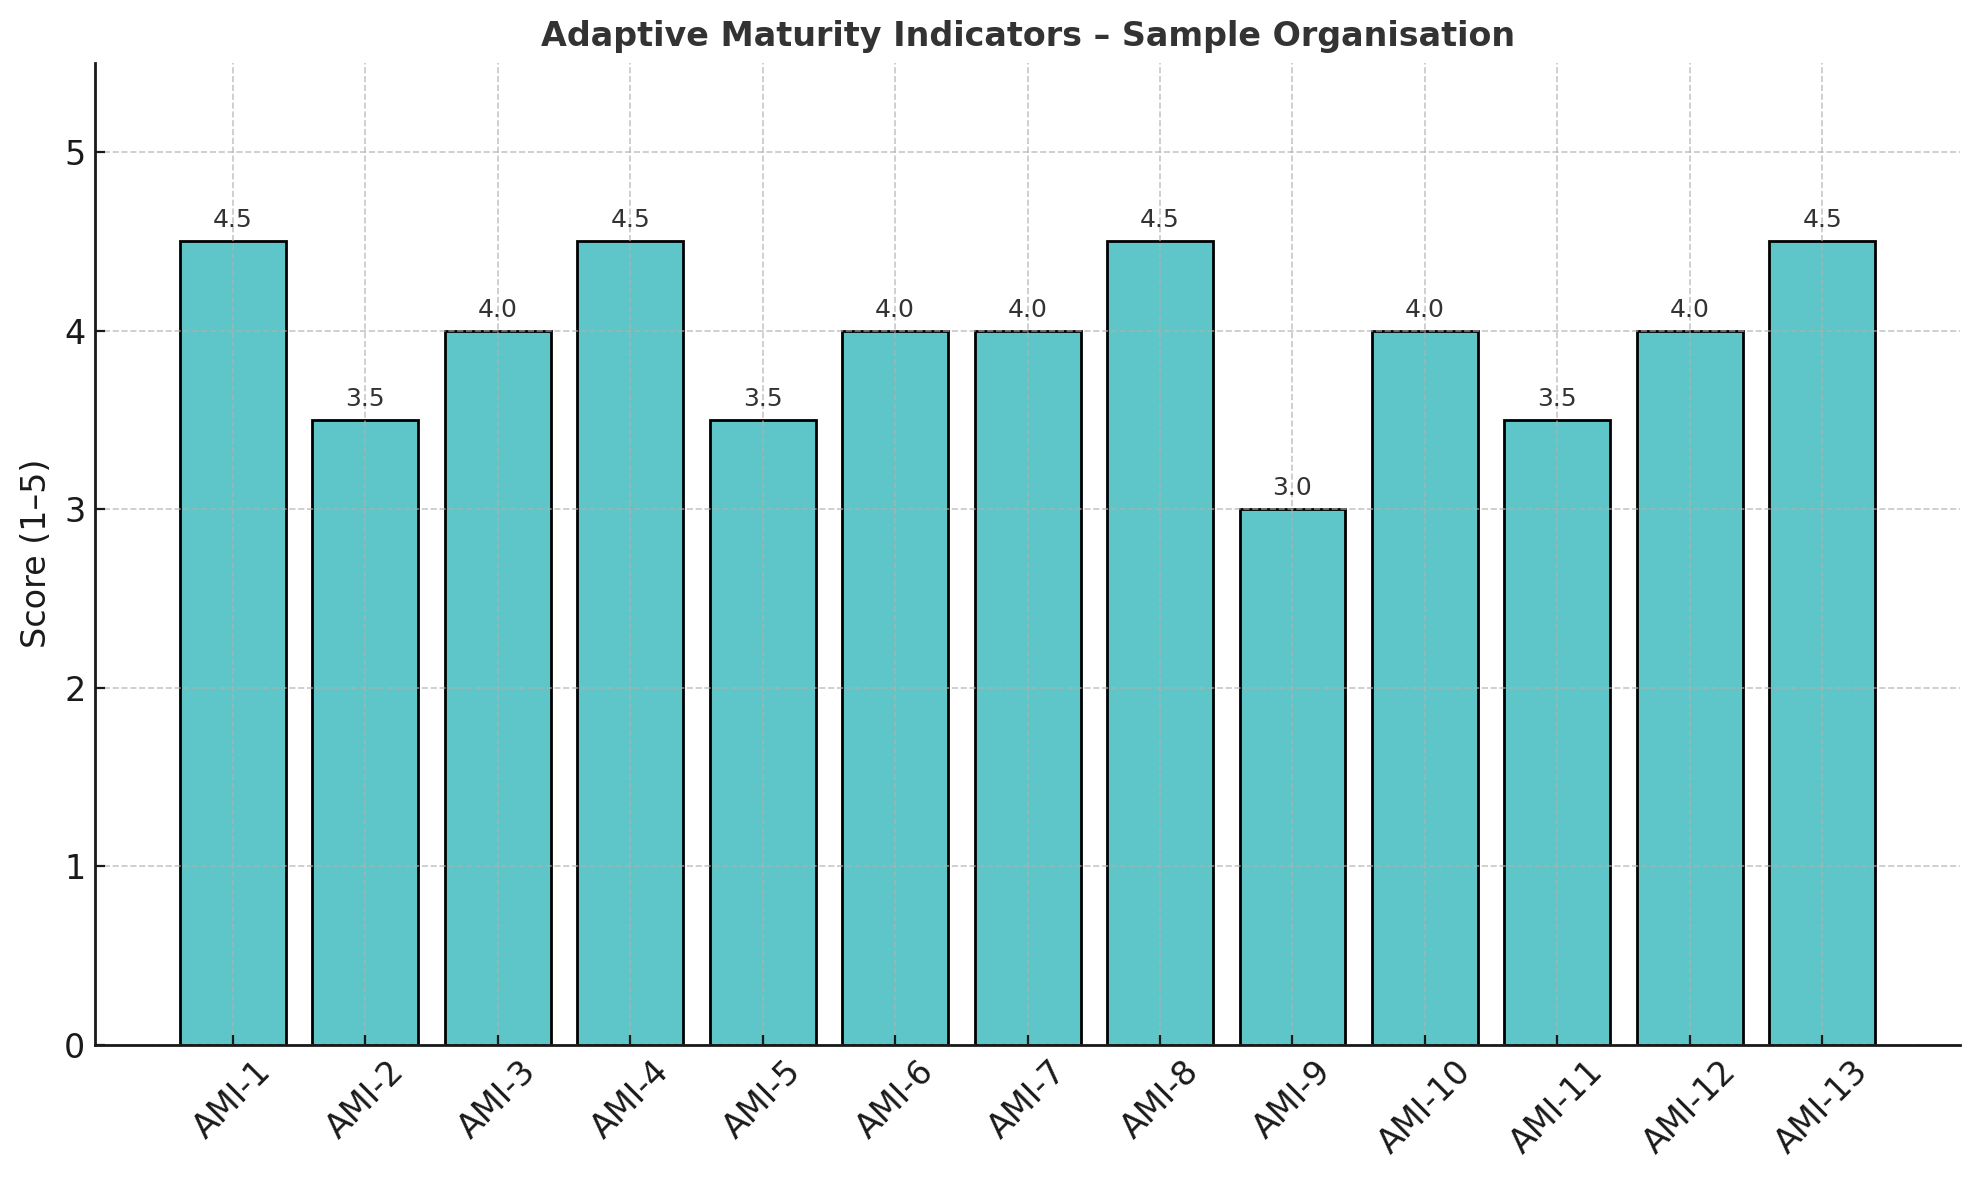
Figure 1. Adaptive Maturity Indicators – Sample Organisation
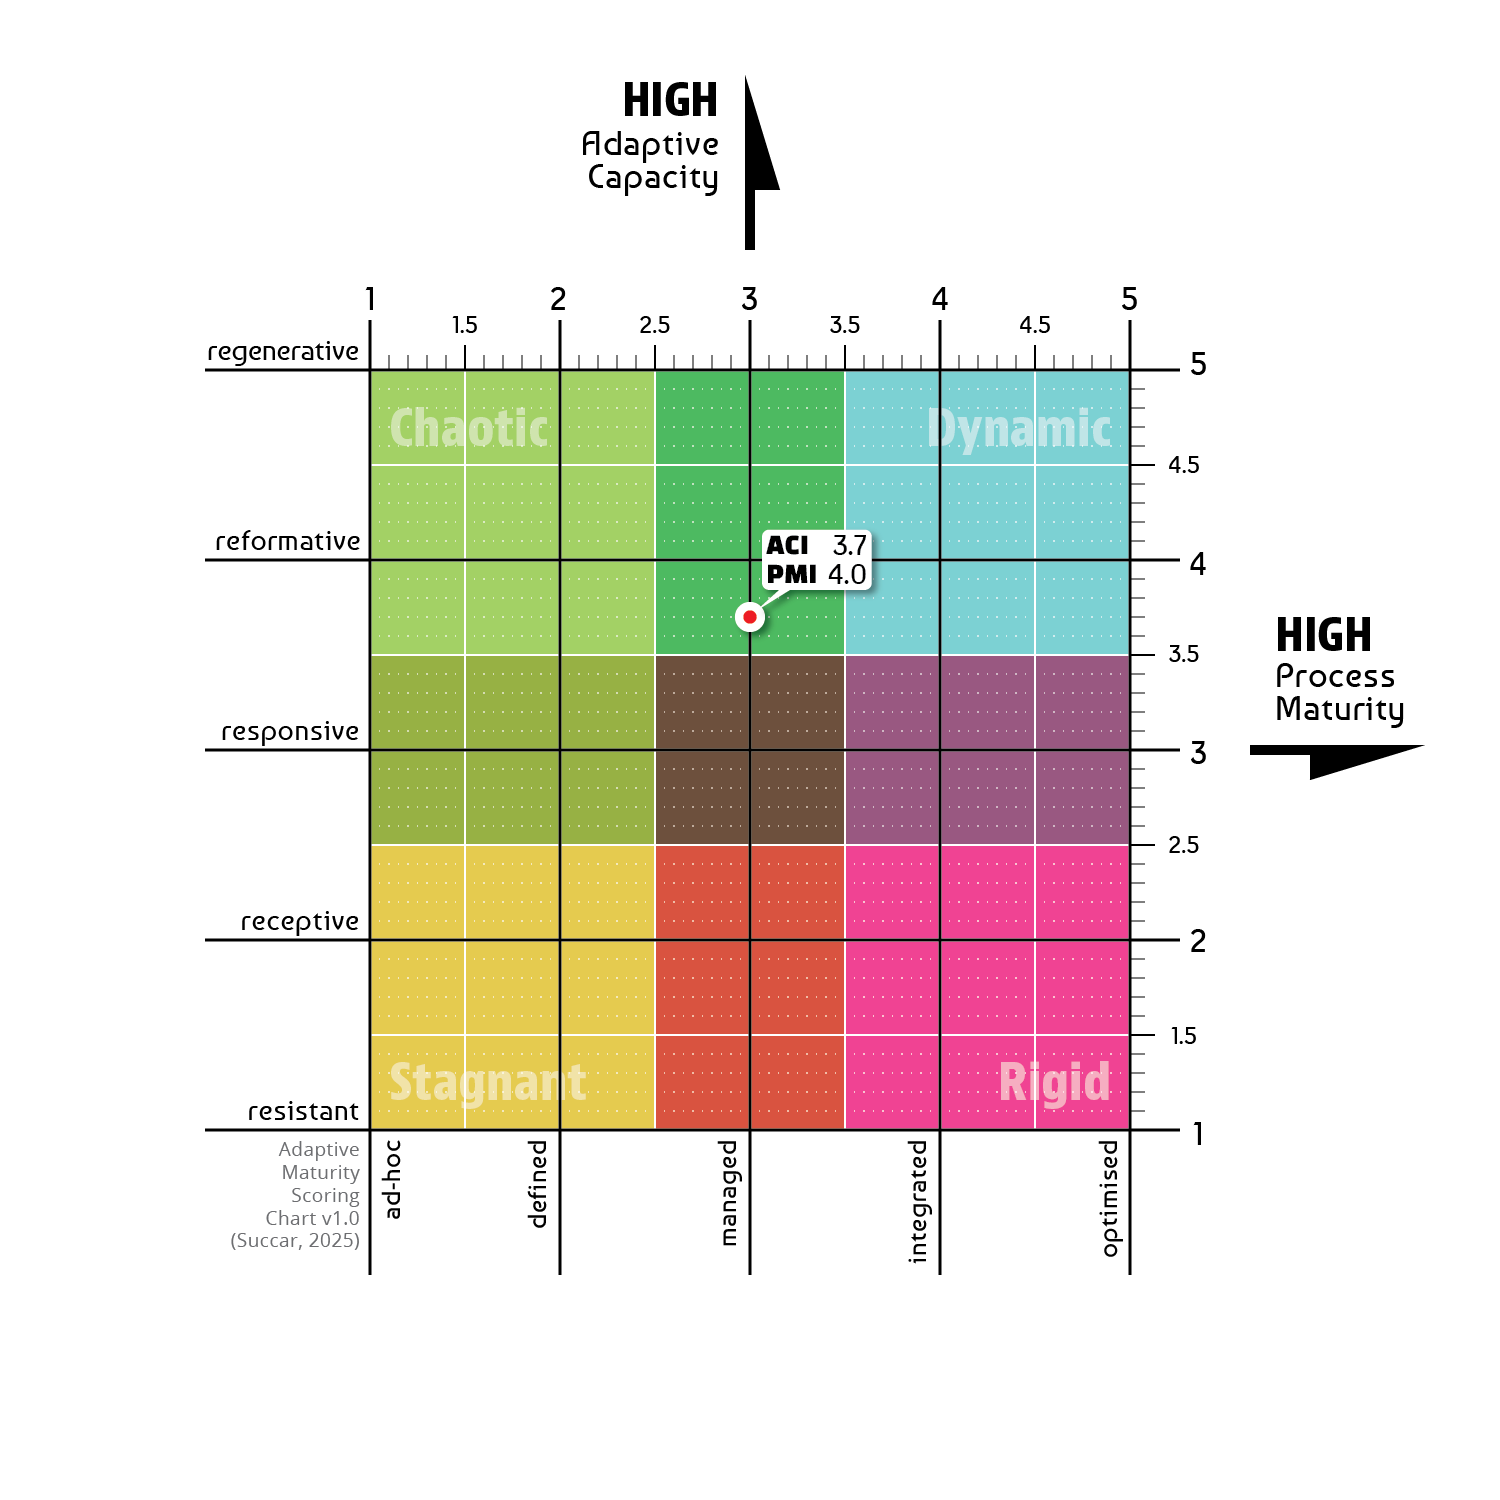
Figure 2. Adaptive Maturity State – Sample Organisation Score
Reflection 1: The assessment method presented above generate a simplified output - a position on a matrix using a single score. It is crucial to remember that this score/position is an abstraction of a complex reality. An organisation scoring perfectly in the middle of the matrix may not be “balanced” but could instead be an unstable combination of highly dynamic teams and deeply rigid departments whose scores cancel each other out. The true value of the assessment is, thus, not the final score or position on the chart but the discussions these provoke and the specific patterns they reveal across the key indicators.
Question 1: Imagine you were tasked to lead an Adaptive Maturity assessment of your own organisation. Which indicator(s) from Table 1 would be the most difficult to score honestly and accurately, and why? Would it be a qualitative indicators like "Energy for change" (AMI-4) due to its subjectivity, or a process-based ones like "Coordination across teams" (AMI-10) due to political sensitivities or a reluctance to acknowledge departmental silos?
Adaptive Maturity - Self Assessment Microtool
To conduct a sample low-detail assessment, please use the below BIMei microtool to assess your/an organisation's Adaptive Maturity. Rate what you know against the 13 AMIs to generate two scores and a placement on the AM States chart. To keep a reference copy for later, feel free to enter your name and download the summary report*.
*This microtool doesn't collect names or data
Like what you're reading? Subscribe to the BIMei Mailing List
Method 2: Detailed Adaptive Maturity Scoring
The second method is more detailed than the first as it evaluates an organisation’s ability to adaptively respond to performance disruptions. The method relies on a matrix derived from the intersection of two indices discussed in Episode 27: the Adaptive Capacity Index (ACI) and the Process Maturity Index (PMI).
The indices have 5 levels, each linked to a numerical score. These scores are generated by asking a series of targeted questions[3] and then applying a weighting of x4 for ACI and x1 for PMI. The weighting reflects the structure of the model: Adaptive Capacity combines four components - agility, resilience, vitality, and culture - while PMI represents one component, maturity.
There are many steps within this method: starting from asking targeted questions (see samples in Table 4), compiling and calculating the mean score for ACI and PMI separately, multiplying the mean ACI scores by x4 (weighting), adding the mean ACI and PMI scores to generate a Composite Score (Table 5), and finally mapping the result onto a 5x5 Scoring Matrix (Figure 3).
After completing these steps, an assessed organisation will fall within one of five Scoring Bands[4] ranging from a Low scoring band (≥10 points on the Composite Score), through Medium-Low (11–20 points), Medium (21–45 points), and Medium-High (46–75 points), to a High scoring band (≥76 points). These bands are representative of how the Dynamic State can only be achieved through high scores on both axes, and that balanced scores on both axes are more conducive to adaptive responsiveness than diametrically opposite scores (high ACI mean with low PMI mean, or visa versa).
Table 4. Adaptive Maturity Assessment - Questions and Action Statements
| # | Comp | Q No. | QLevel | Question Title | Action Statement |
|---|---|---|---|---|---|
| 1 | Agility | 1 | QL1 | Does your organisation reallocate resources during disruptions? | Reallocate resources promptly to sustain operations during disruptions |
| 2 | Agility | 1 | QL2 | Are reallocations guided by documented prioritisation rules? | Establish and apply prioritisation rules for reallocating resources |
| 3 | Agility | 2 | QL1 | Do workflows adapt when market or regulatory requirements shift? | Review and update workflows regularly to reflect new requirements |
| 4 | Agility | 2 | QL2 | Are workflow updates coordinated across business units? | Coordinate workflow updates across all relevant business units |
| 5 | Agility | 3 | QL1 | Can operational decisions be taken without escalation? | Delegate authority to managers to accelerate operational decisions |
| 6 | Agility | 3 | QL2 | Are delegated rights formally reviewed? | Review and adjust delegated authority regularly |
| 7 | Agility | 4 | QL1 | Does leadership encourage experimentation with new ideas? | Conduct pilot projects to test and refine new ideas |
| 8 | Agility | 5 | QL1 | Does the organisation adopt digital tools quickly? | Implement digital tools within six months of identification |
| 9 | Agility | 6 | QL1 | Do teams redesign practices after disruptions? | Empower teams to redesign practices in response to disruptions |
| 10 | Agility | 7 | QL1 | Are risks reviewed before pivoting to new approaches? | Conduct structured risk–opportunity reviews before pivots |
| 11 | Agility | 8 | QL1 | Do cross-functional teams coordinate rapid responses? | Form cross-functional teams to coordinate rapid responses to disruptions |
| 12 | Agility | 9 | QL1 | Is agility monitored as part of performance management? | Monitor agility indicators within the performance management system |
| 13 | Resilience | 1 | QL1 | Does your organisation have continuity plans? | Develop continuity plans to respond to performance disruptions |
| 14 | Resilience | 1 | QL2 | Are continuity plans tested regularly? | Test continuity plans through annual simulations |
| 15 | Resilience | 1 | QL3 | Are continuity plans updated after each disruption or test? | Update continuity plans systematically after disruptions or tests |
| 16 | Resilience | 2 | QL1 | Does your organisation maintain reserves of critical resources? | Maintain a three-month reserve of critical resources to accommodate unforeseen disruptions |
| 17 | Resilience | 3 | QL1 | Are suppliers diversified to mitigate risks? | Source key inputs from at least three independent suppliers |
| 18 | Resilience | 4 | QL1 | Does your organisation maintain redundancy in digital systems? | Maintain mirrored cloud environments across two regions |
| 19 | Resilience | 5 | QL1 | Do you measure recovery times from major disruptions? | Achieve operational recovery within 48 hours of critical system failure |
| 20 | Resilience | 6 | QL1 | Are risk assessments integrated into planning processes? | Integrate structured risk assessments into strategic and operational planning |
| 21 | Resilience | 7 | QL1 | Are staff trained in emergency protocols? | Train staff annually in emergency response protocols |
| 22 | Resilience | 8 | QL1 | Are resilience metrics tracked at the executive level? | Track resilience metrics at executive level reporting dashboards |
| 23 | Resilience | 9 | QL1 | Do business units share lessons from past disruptions? | Share lessons from disruptions across business units through structured reports |
| 24 | Vitality | 1 | QL1 | Do you measure staff morale regularly? | Conduct quarterly staff morale surveys with participation exceeding 70% |
| 25 | Vitality | 2 | QL1 | Are wellbeing initiatives available for employees? | Provide weekly wellbeing activities accessible to all staff |
| 26 | Vitality | 3 | QL1 | Does your organisation channel staff creativity into innovation? | Conduct structured workshops to encourage innovation at regular periods |
| 27 | Vitality | 3 | QL2 | Are innovation outcomes captured and shared organisation-wide? | Document and disseminate innovation outcomes across the organisation |
| 28 | Vitality | 4 | QL1 | Do you monitor burnout indicators? | Track absence and sick leave rates annually to identify vitality risks |
| 29 | Vitality | 5 | QL1 | Are employees motivated to join adaptive initiatives? | Maintain volunteer pools for rapid-response initiatives |
| 30 | Vitality | 6 | QL1 | Do you recognise adaptive energy among teams? | Incentivise teams that demonstrate adaptive energy through recognition schemes |
| 31 | Vitality | 7 | QL1 | Do leaders promote vitality programmes? | Promote vitality programmes consistently at leadership level |
| 32 | Vitality | 8 | QL1 | Are vitality initiatives aligned with organisational goals? | Align vitality programmes with organisational strategic objectives |
| 33 | Vitality | 9 | QL1 | Do staff have access to professional development? | Provide continuous professional development to sustain adaptive vitality |
| 34 | Culture | 1 | QL1 | Are adaptability and learning part of organisational values? | Embed adaptability and learning into organisational value statements |
| 35 | Culture | 2 | QL1 | Is knowledge sharing actively encouraged? | Provide open-access repositories and encourage staff to contribute knowledge |
| 36 | Culture | 3 | QL1 | Is cross-departmental collaboration supported? | Incentivise cross-departmental collaboration through rewards and recognition |
| 37 | Culture | 4 | QL1 | Does your organisation treat failure as a learning opportunity? | Publish lessons-learned briefs after each project or disruption |
| 38 | Culture | 5 | QL1 | Are cultural barriers to change actively removed? | Update organisational policies annually to eliminate outdated practices |
| 39 | Culture | 6 | QL1 | Do leaders role-model adaptive culture? | Demonstrate adaptive behaviours consistently at leadership level |
| 40 | Culture | 7 | QL1 | Does your organisation recognise champions of change? | Incentivise individual champions who promote adaptive change |
| 41 | Culture | 8 | QL1 | Are shared norms reinforced through rituals or routines? | Reinforce adaptive norms through organisational rituals and routines |
| 42 | Culture | 9 | QL1 | Is diversity considered a strength in adaptive practices? | Integrate diversity principles into adaptive practices |
| 43 | Culture | 10 | QL1 | Do teams celebrate successful adaptations? | Celebrate adaptive successes through public recognition events |
| 44 | Culture | 11 | QL1 | Is learning from disruptions embedded culturally? | Embed post-disruption learning into organisational culture statements |
| 45 | Maturity | 1 | QL1 | Are core processes documented? | Document all core processes in a central repository |
| 46 | Maturity | 1 | QL2 | Are documented processes updated regularly? | Update process documentation annually or after major changes |
| 47 | Maturity | 2 | QL1 | Are responsibilities and accountabilities clearly defined? | Define role descriptions with clear accountabilities |
| 48 | Maturity | 3 | QL1 | Is performance monitored systematically? | Implement performance indicators reviewed monthly |
| 49 | Maturity | 4 | QL1 | Are workflows integrated across departments? | Align at least 80% of workflows across business units |
| 50 | Maturity | 5 | QL1 | Does your organisation conduct regular audits of processes? | Conduct structured process audits at least twice annually |
| 51 | Maturity | 6 | QL1 | Are improvements systematically identified? | Identify opportunities for continuous improvement through audits and reviews |
| 52 | Maturity | 7 | QL1 | Do processes incorporate risk–opportunity analysis? | Integrate risk–opportunity reviews into process improvement cycles |
| 53 | Maturity | 8 | QL1 | Are process changes communicated effectively? | Communicate process changes promptly to all relevant stakeholders |
| 54 | Maturity | 9 | QL1 | Are maturity levels benchmarked against standards? | Benchmark organisational maturity against relevant standards and peers |
| 55 | Maturity | 10 | QL1 | Do improvement initiatives extend across the organisation? | Implement improvement initiatives across multiple organisational units |
| 56 | Maturity | 11 | QL1 | Is maturity progress tracked over time? | Track and report maturity improvements on an annual basis |
Table 5. Scoring Matrix – Sample Organisation
| Component | Average Score | Notes |
|---|---|---|
| Organisational Agility | 3.42 | Mean of rows 1–12 |
| Organisational Resilience | 3.45 | Mean of rows 13–23 |
| Organisational Vitality | 3.40 | Mean of rows 24–33 |
| Organisational Culture | 3.36 | Mean of rows 34–44 |
| Process Maturity (PMI) | 3.17 | Mean of rows 45–56 |
| Adaptive Capacity Index (ACI) | 3.41 | (Agility + Resilience + Vitality + Culture) / 4 |
| Composite Score | 16.81 (16) (Figure 4) | (ACI x 4) + (PMI x 1) – rounded to the closest scoring point |
| Score Banding | Medium-Low | (Scoring range 11–20) |
| Current Microstate | Defined-Receptive | Description from Episode 27: “Documented processes provide a stable frame yet permit only timid alterations; disruptions prompt incremental tweaks not full pivots; learning is imitative...” |
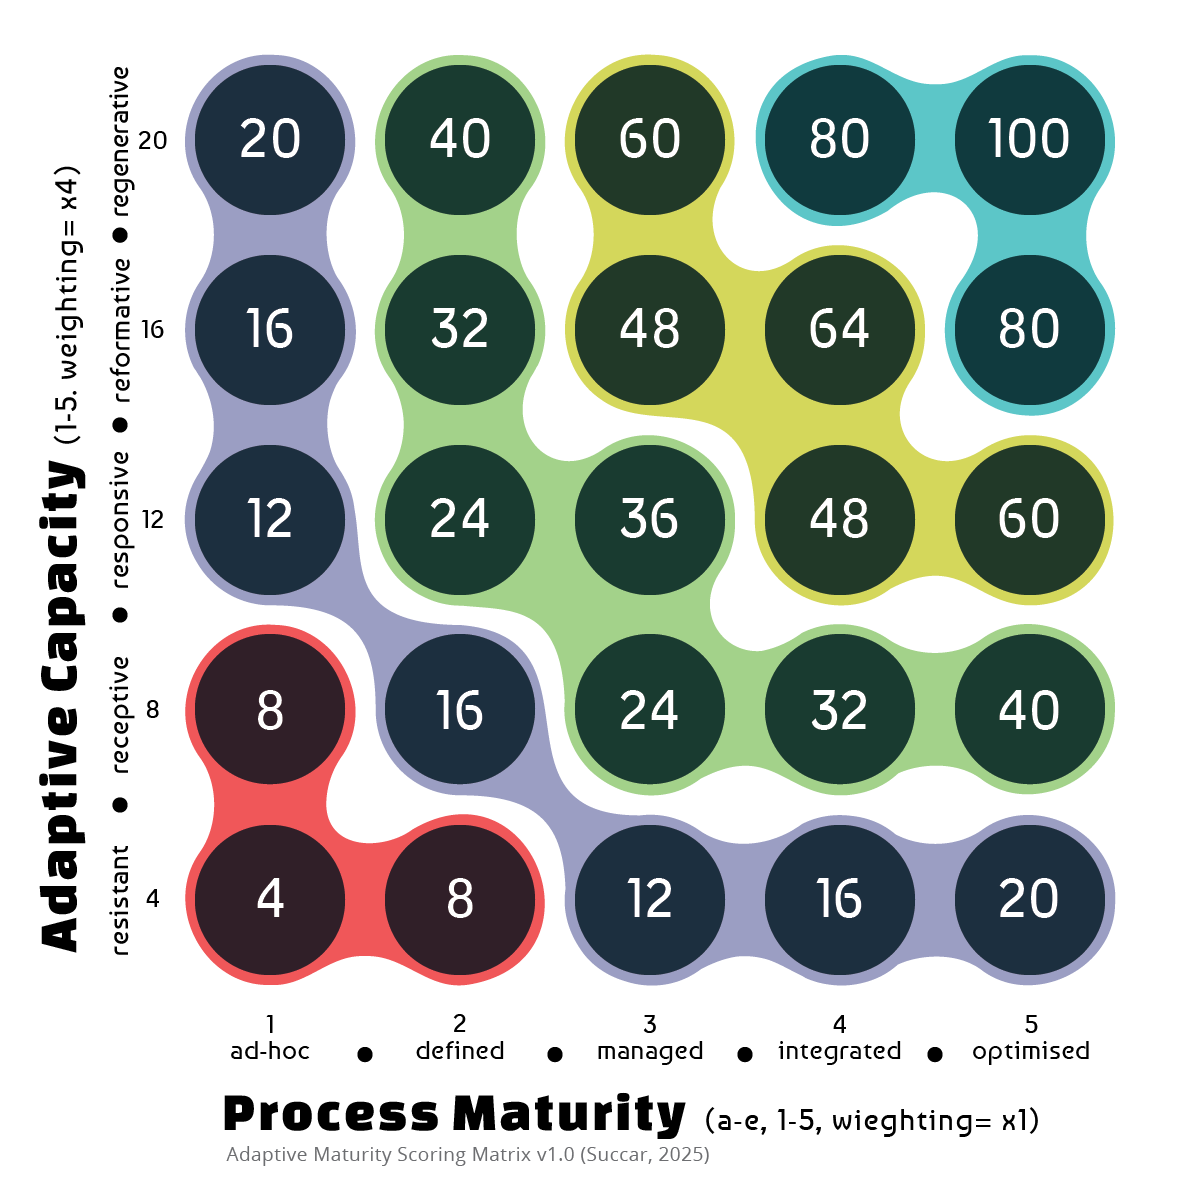
Figure 3. Adaptive Maturity Scoring Matrix
Low ≥10, Medium-Low 11-20, Medium 21-45, Medium-High 46-75, High ≥76
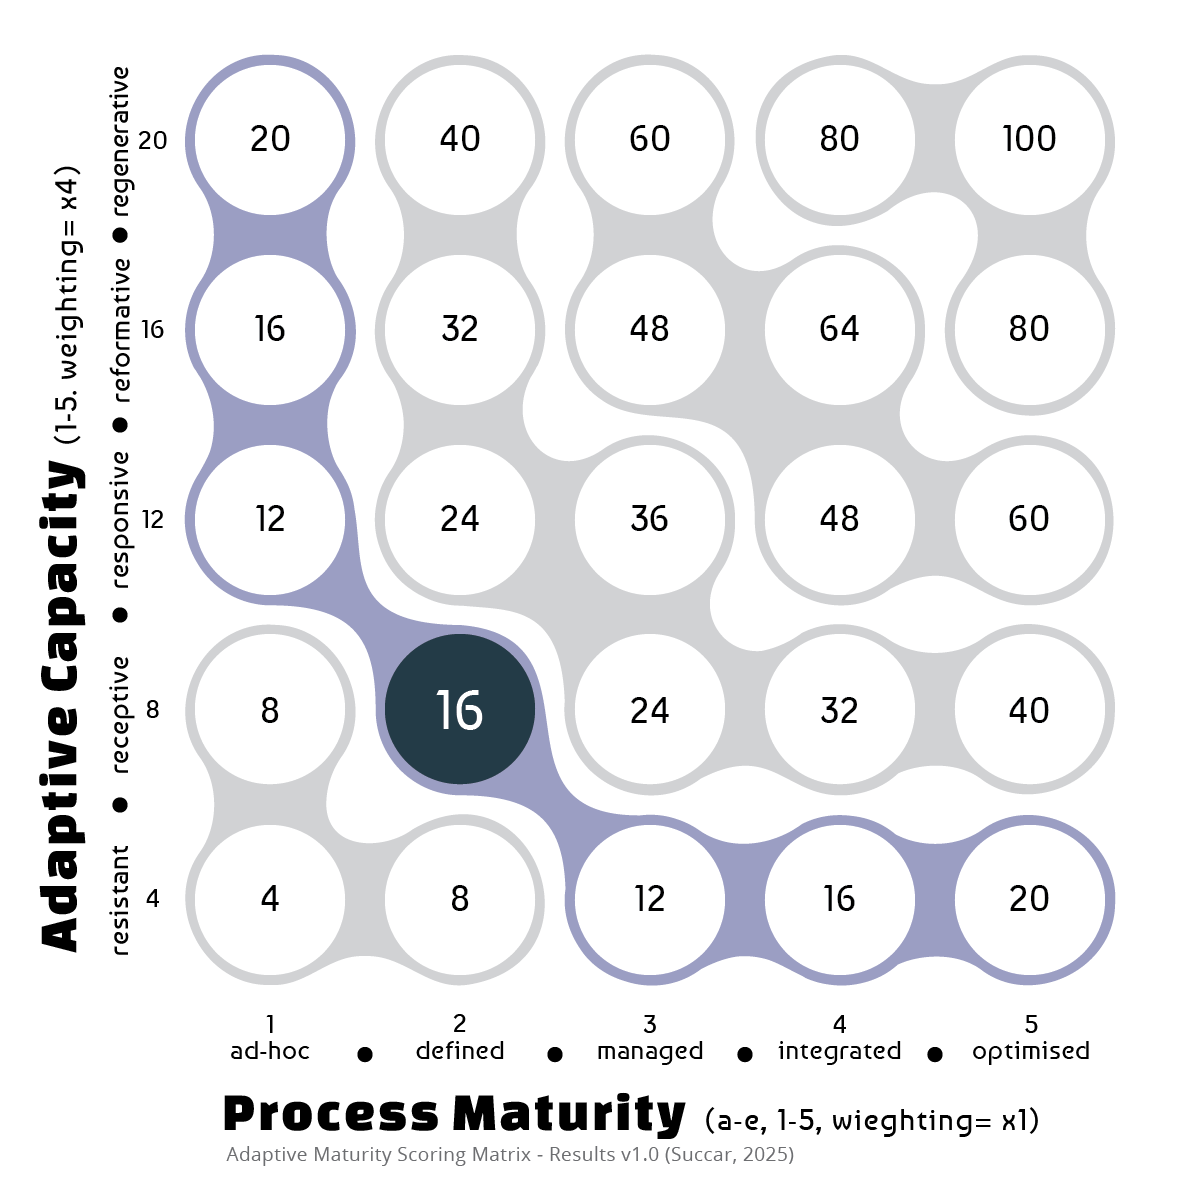
Figure 4. Adaptive Maturity Scoring Matrix - Sample Result
Sample organisation score is 16.8 (rounded to closest scoring point).
Reflection 2: The deliberate 4:1 weighting of the Adaptive Capacity Index over the Process Maturity Index in the Composite Score is a core aspect of the Adaptive Maturity model. The difference in weighting asserts that an organisation's agility, resilience, vitality, and culture are, combined, four times more influential on its adaptive success than its documented processes alone. That is, an organisation cannot simply engineer its way to high performance with excellent workflows and the latest systems if it lacks the human energy, cultural alignment, and resilience to handle disruption. This Assessment Method suggests that what is documented and even standardised is only one-fifth of the story; how the organisation lives, learns, and leads is the rest.
Question 2: Review at the detailed questions in Table 4. For many of these, a gap may exist between the official answer (what a process document or manager might say) and the practical reality (what a frontline employee experiences). For example, a continuity plan might exist on paper (prompting a “yes”), but if it hasn't been tested in years and staff don't know it exists, what is the real score? In your organisation, which of the five components - Agility, Resilience, Vitality, Culture, or Maturity - would have the largest gap between its “official” score and its “real/lived” score, and what does that tell you?
Comparing the two methods
The Adaptive Maturity Indicators (AMI)s and the Scoring Matrix (ACI×PMI) are complementary methods (Table 6). AMIs provide a conceptual cross-section that clarifies an organisation’s current Adaptive Maturity State and supports transition tracking, while the Scoring Matrix delivers a quantitative benchmark for generating improvement plans and comparing performance across entities. Together, they offer a diagnostic lens for understanding Adaptive Maturity states and a scoring mechanism for continuous assessment and planning.
Table 6. Comparative Measurement Methods
| Adaptive Maturity Indicators (AMI)s | Scoring Matrix (ACIxPMI) | |
|---|---|---|
| Goals | Establishing the current Adaptive Maturity State | Developing an Adaptive Maturity Benchmark and a set of Adaptive Maturity Improvement Plans |
| Conceptual Layer | Cross-section of Adaptive Capacity and Process Maturity concepts | Intersection of Adaptive Capacity Index and Process Maturity Index |
| Measurement Layer | 13 AMIs 9 correspond to ACI, 2 to PMI, and 2 to ACI+PMI 5-level index per AMI (Score 1-5) Average single scores for ACI and PMI |
X Questions per Adaptive Component (depends on Granularity Level) For Adaptive Capacity, scores are calculated as the Average of the Sum of Average Scores of AC components (Agility, Vitality, Resilience, Culture). |
| Analytical Layer | Two average scores (ACI + PMI) determine the X/Y position on the 5×5 matrix. Scores are averaged to one decimal place. The position maps to the 2×2 AM States Matrix to determine the current State or Overlap Area. |
Single total score plotted on the 5×5 AM Scores Matrix. Weighting: ACI ×4, PMI ×1. |
| Interpretive Layer | Clarify current AM State Track AM Transition Actions Communicate with non-technical staff |
Generate AM Benchmarks and AM Improvement Plans Predict adaptive responsiveness during disruptions Use as an instrument for AM assessment and guided improvement |
Improving Adaptive Maturity
The purpose of AM assessment is AM improvement. To realise the desired Return on Effort (RoE) from conducting detailed AM evaluations, the data collected and insights generated must be reinvested into planning and delivering targeted performance-improvement activities. Here, improving Adaptive Maturity should not be perceived as a task to be completed or as a score to be achieved, but as an ongoing effort to to align an organisation’s mission with the responsiveness it needs to achieve evolving operational and strategic goals.
For many organisations - in the construction industry, for example - the Dynamic State represents an attractive target as it combines stability with agility, resilience and vitality. Reaching this State requires accurate assessment followed by a calibrated sequence of actions that progressively transition an organisation along both axes. To illustrate these State Transitions (refer to Episode 27), this below list and mind map present sample simplified pathways that can be tailored to an organisation’s starting State and strategic priorities.
Sample List - partial steps
- Transitioning away from a Stagnant State: organisations in a Stagnant State typically suffer from both low adaptive capacity and low process maturity. To escape this State, an organisation must simultaneously inject energy and create structure. This can be approached via two strategic pathways, depending on whether the immediate priority is rapid innovation or foundational control:
- Path A: Stagnant -> Chaotic -> Dynamic (prioritising Adaptive Capacity). This path is often faster for stimulating innovation but risks creating initial instability and causing financial waste:
- Introduce Disruptions (S -> C) - the first goal is to break inertia by:
- Empowering Champions with budgets and the autonomy to run pilot projects.
- Legitimising Experimentation by creating “innovation sandboxes” where teams can test new tools and ideas without fear of failure.
- Seeding New Ideas by exposing the organisation to external thinking through industry events, expert talks, and collaborations.
- Focusing on immediate gains by implementing new tools and processes without adequate testing.
- Set Up Systems (C -> D) - once a more open culture emerges, or quick initial wins are achieved, the next step is to channel that chaotic energy into productive, scalable systems by:
- Harvesting Lessons-learned through a workshops and deep-analysis of pilot project outcomes.
- Scaling Success by diffusing the tools and practices across the organisation.
- Path B: Stagnant -> Rigid -> Dynamic (prioritising Process Maturity). This path is more controlled and builds a stable foundation first, but can initially slow down the pace of change, and cause process waste.
- Generate Structures (S -> R) - the priority here is to create order and predictability by:
- Codifying Core Processes by documenting essential workflows and clarifying roles and responsibilities.
- Mandating Uniform Templates by implementing standards so common activities and outcomes are delivered consistently.
- Centralising Governance by establishing clear approval gates to enforce compliance.
- Decrease Rules & Increase Flexibility (R -> D) - with a stable operational skeletal in place, the focus shifts to introducing agility by:
- Empowering Teams by replacing prescriptive rules with guiding principles/boundaries and giving teams the authority to make decisions within those boundaries.
- Rewarding Adaptive Behaviour by update performance metrics to reward – instead of unquestioning compliance – critical thinking, experimentation, and innovation.
- Generate Structures (S -> R) - the priority here is to create order and predictability by:
- Introduce Disruptions (S -> C) - the first goal is to break inertia by:
- Path A: Stagnant -> Chaotic -> Dynamic (prioritising Adaptive Capacity). This path is often faster for stimulating innovation but risks creating initial instability and causing financial waste:
- Transitioning from a Chaotic State to a Dynamic State: an organisation in a Chaotic State is highly energetic but typically suffers from inefficiencies and inability to scale its successes. The key is to introduce process maturity without curtailing its innovative spirit. The main actions can be summarised as Setting Up Systems by:
- Prioritising Initiatives based on a clear strategic roadmap that focuses the organisation's energy by linking innovation efforts directly to business goals.
- Establishing Light Governance through introducing process-checking (e.g. stage-gates for major projects) to ensure accountability without creating bureaucracy.
- Building a Knowledge Hub by creating a central repository for sharing experimentation results and best practices thus preventing separate teams from ‘reinventing the wheel’.
- Transitioning from a Rigid State to a Dynamic State: a rigid organisation can be efficient and productive but is slow to react to any major disruption thus risking becoming obsolete over time. The key here is to increase adaptive capacity without creating instability. The main actions can be summarised as Decreasing Rules and Increasing Flexibility by:
- Decentralising Decision-Making by empowering staff to make operational decisions thus reducing bureaucratic bottlenecks.
- Creating Cross-Functional Teams with adequate resources, skillsets, and autonomy to tackle emerging opportunities and challenges.
- Shifting the mindset from Risk Aversion to Risk Awareness by training teams in “balanced risk-taking” (AMI-9) thus encouraging taking calculated risks that have clear learning objectives and acceptable/manageable downsides.
Sample Mindmap - simplified steps
These sample pathways are only a guide. A successful transition from one AM State to another will involve elements from different pathways applied iteratively. The key is to maintain constant awareness of the organisation's current State and to make timely decisions to steer it as per the overall AM improvement strategy.
[Bonus microtool added in v2.o: Below is an interactive version of the Adaptive Maturity Matrix (refer back to Episode 27). Use the AMX Investigate and Plan microtool to search for definitins discussed in Episode 27, and to further clarify your pathway to improving your organisation's Adaptive Maturity].
Reflection 3: while the Dynamic State is often presented as the ideal, a highly effective organisation may intentionally nurture different States in different departments. For example, a research and development unit might thrive in a more Chaotic environment, while a safety compliance team must operate with Rigidity. The ultimate sign of Adaptive Maturity could be the ability to manage an internal portfolio of States, allowing each part of the organisation to operate in the mode best suited to its function.
Question 3: considering your organisation' or department’s current State, what is the key dynamic (single greatest force) preventing a desirable transition? Is it a cultural resistance to new ideas (characteristic of Stagnation), a fear of losing control by adding flexibility (a hallmark of Rigidity), or a reluctance to impose structure on creative energy (a trait of Chaos)?
In Summary
Adaptive Maturity is a broad concept that applies to nearly all actions an organisation undertakes in preparation for, or in response to, performance disruption. If every small change constitutes a micro-disruption and every consequential shift represents a major one, then it is difficult to imagine a context in which the components of Adaptive Maturity are irrelevant, or in which evaluating AM responsiveness is not essential.
The terms, indices, indicators, and models introduced in this episode - and across the AM series - provide a diagnostic lens for understanding why organisations respond to digital transformation challenges in the ways they do. They help clarify why some responses succeed, others falter, and many are never attempted.
By examining the interplay between an organisation’s Adaptive Capacity and its Process Maturity, change agents gain a more accurate understanding of its ability to respond to disruption. For researchers, these concepts offer a structured foundation for analysing digital transformation efforts and for explaining why some organisations thrive amid disruption while others are reshaped by it.
References
Endnotes
[1] Completeness vs usefulness is a key balancing act. A good example of a useful image that is not/never complete is a Google Maps view: while it doesn't include every road feature, tree and pothole, it is still useful (achieves the purpose of guiding a person to their destination). The same principle applies to AMIs: although the 13 key indicators do not cover every aspect of Adaptive Capacity and Process Maturity, they still provide a useful, albeit incomplete, guide to establish an organisation's Adaptive Maturity.
[2] Change agents are internal champions and external consultants who help organisations to improve their performance.
[3] The selection and number of questions depend on the chosen Granularity Level. At the lowest level (GLevel 1) used in this episode, each adaptive component includes 8–12 diagnostic questions. Each question is linked to an Action Statement describing observable behaviour, allowing assessors to focus on evidence rather than opinion (Action Statements will be covered in a separate BIM ThinkSpace Episode or BIM Framework post).
[4] Scoring Bands are tentative and subject to refinement as additional is collected and analysed. While the Microstates and their matrix scoring have stabilised, it is still possible that the boundaries of Scoring Bands with change over time.
Further Reading
Many of the concepts discussed in Episode 28 have cited references in Episodes 26 and 27. Below are additional reading materials to further expand upon these:
- Arvanitis, L., Al-Tarazi, D., Agyekum, K., Kissi, E., Manu, P., Mahamadu, A. M., Booth, C., Prabhakaran, A. & Pittri, H. (2025). BIM maturity and its influence on BIM implementation challenges: the perspectives of UK contractors. Proceedings of the Institution of Civil Engineers-Management, Procurement and Law, 1-13. Available from https://uwe-repository.worktribe.com/OutputFile/14414700 (author accepted version), last accessed Aug 2, 2025.
- Blind, K., Petersen, S. S., & Riillo, C. A. (2017). The impact of standards and regulation on innovation in uncertain markets. Research policy, issue 46(1), pp 249-264. Available from https://www.sciencedirect.com/science/article/pii/S0048733316301743, last accessed July 10, 2025.
- Close, K., Grebe, M., Andersen, P., Khurana, V., Franke, M.R. and Kalthof, R. (2020), “The digital path to business resilience”, Boston Consulting Group Report. Available from https://web-assets.bcg.com/af/28/359647864f67a53a16ec1e5200cc/bcg-the-digital-path-to-business-resilience-jul-2020.pdf, last accessed Jul 20, 2025.
- -H. Shin, H. Kim, J. Hwang, Standardization revisited: a critical literature review on standards and innovation, Computer Standards & Interfaces, issue 38, pp 152–157. Available from https://doi.org/10.1016/j.csi.2014.09.002, last accessed Jul 15, 2025.
- de Groot, B., Leendertse, W., & Arts, J. (2024). Collective learning in project-oriented organisations in infrastructure planning: Interaction for adaptation. Public Works Management & Policy, 29(3), 415–445. Available from https://journals.sagepub.com/doi/epub/10.1177/1087724X231200816, last accessed Jul 20, 2025.
- Duchek, S. (2020). Organisational resilience: A capability-based conceptualisation. European Management Journal, 38(6), 1009–1018. Available from https://link.springer.com/article/10.1007/s40685-019-0085-7, last accessed Aug 13, 2025.
- Tassey (2000), Standardization in technology-based markets, Research Policy, issue 29 (4–5), pp 587–602. Available from https://doi.org/10.1016/S0048-7333(99)00091-8, last accessed Jul 15, 2025.
- Hewitt Associates (2009), Engagement and Culture: Engaging Talent in Turbulent Times, Point of View series. Available from https://www.aon.com/apac/attachments/talent_turbulent_times.pdf, last accessed Aug 1, 2025.
- Irfan, M., Alaloul, W. S., Ghufran, M., Yaseen, G., Thaheem, M. J., & Qureshi, A. H. (2024). Analyzing the impact of organizational culture on social sustainability: A perspective of the construction industry. Environment, Development and Sustainability, 26(2), 1103–1133. Available from https://www.researchgate.net/publication/365195366_Analyzing_the_impact_of_organizational_culture_on_social_sustainability_a_perspective_of_the_construction_industry, last accessed Jul 20, 2025.
- ISO (2017), Security and resilience - Organizational resilience - Principles and attributes, ISO 22316:2017(en), International Standards Organisation (ISO). More information https://www.iso.org/obp/ui/#iso:std:iso:22316:ed-1:v1:en, last checked Jul 15, 2025.
- H. Allen, R.D. Sriram, The role of standards in innovation, Technological Forecasting and Social Change, issue 64 (2–3), pp 171–181. Available from https://doi.org/10.1016/S0040-1625(99)00104-3, last accessed Jul 15, 2025.
- Rani, A. M., & Senen, S. H. (2023), Navigating Cultural Entropy: Leadership Strategies and Organizational Dynamics in Higher Education Institutions, West Science Economic and Entrepreneurship, Vol. 1, No. 12, pp. 511~520. Available from https://pdfs.semanticscholar.org/c6f9/727cdf4421100c7443bbf52d537bc1a4c0ef.pdf, last accessed Aug 1, 2025.
- Vial, G. (2021). Understanding digital transformation: A review and a research agenda. Managing digital transformation, 13-66. Retrieved from https://doi.org/10.1016/j.jsis.2019.01.003 (require institutional access), last accessed Jul 20, 2025.
- Walter, A. T. (2021). Organizational agility: ill-defined and somewhat confusing? A systematic literature review and conceptualization. Management Review Quarterly, 71(2), 343-391. Available from https://link.springer.com/article/10.1007/s11301-020-00186-6, last accessed Jul 15, 2025.
- Yu, D., & Hang, C. C. (2010). A Reflective Review of Disruptive Innovation Theory. International Journal of Management Reviews, 12(4), 435-452. Available from https://www.academia.edu/download/53149454/A_Reflective_Review_of_Disruptive_Innovation_Theory.pdf, last accessed Jul 18, 2025.
- Zadeh, P. A., Thibault, J. M., Staub-French, S., & Bhonde, D. (2025). Understanding the Disruptiveness of Integrated Project Delivery (IPD) in the AEC Industry. Buildings, 15(13), 2338. Available from https://doi.org/10.3390/buildings15132338, last accessed Jul 18, 2025.
Version Control
|
V. |
Description |
Date |
|
1 |
First releaseDe |
Dec 10, 2025 |
|
2 |
- Added interactiven Adaptive Maturity Matrix (Investigate, Plan) too |
Jan 27, 2026 |
|
… |
- |
- |
Cite as: BIMe Initiative (2026), 'Episode 28: Measuring Adaptive Maturity', https://bimexcellence.org/thinkspace/episode-28-measuring-adaptive-maturity/. First published 10 December 2025. Viewed 11 February 2026